X1.4 Solar Flare

There was a solar flare this morning, starting at around 1030 UTC and peaking at a level of X1.4 at around 1100 UTC.

Solar flares are sudden bright areas that appear on the Sun. They emit a large burst of energy at various wavelengths, including x-rays, as the graph below shows:
X-Ray Graph of Solar Flare

A movie of the flare is available here: http://sdowww.lmsal.com/sdomedia/h264/2011/09/22/SSW_cutout_20110922T1024-20110922T1159_AIA_211-193-171_N09E89.mov

They also eject a large number of charged particles, such as electrons and protons. The effect of the x-rays is immediate, as soon as they reach the Earth (taking about 9 minutes at the speed of light) they cause a sudden increase in ionization of the ionosphere, but not in a good way. The D layer, which attenuates radio waves, rather than reflecting them, becomes strong enough to block large portions of the HF band. The D layer is what prevents long distance reception of MW signals during the daytime. With a stronger D layer, due to the flare, this attenuation moves up into the HF bands as well.

Depending on the intensity of the flare, frequencies to 10, 15, or 20 MHz, or possibly even the entire HF spectrum, can be completely blocked. The effect is only present on the portion of the ionosphere in daylight, nighttime areas are not affected. As I type this, at 1400 UTC, CHU on 3330 is completely absent. The x-ray levels are down to about the M1 level now, earlier I suspect higher frequencies were being attenuated as well.

Solar flares are categorized by their intensity at x-ray wavelengths. A log type scale is used, much as for earthquakes. An X1 flare is ten times as strong as an M1 flare, which is ten times as strong as a C1 flare, for example. Within each letter, numbers are used to further classify the intensity. An M2 flare is twice a strong as an M1 flare. An X1 flare would be equivalent to an M10 flare, if such a designation existed.

Although strong solar flares can be highly disruptive to HF, they do allow the reception of some signals that would otherwise be difficult to receive, depending on the various locations of the stations and your QTH. A flare could cause the signal from the dominant station on a particular frequency to be heavily attenuated (if the path between your location and that station is in the sunlight portion of the Earth), while allowing another station (if the path to that station is in darkness) to be received.

Realtime solar x-ray flux values, as measured by the GOES weather satellites, are available at this link: http://www.swpc.noaa.gov/rt_plots/xray_1m.html

There is also a graph with a slower (5 minute vs 1 minute) update rate here: http://www.swpc.noaa.gov/rt_plots/xray_5m.html

This particular flare was on the limb of the Sun, so any charged particles ejected by it are not likely to be directed to the Earth. When flares do produce Earth directed CMEs (Coronal Mass Ejections), the charged particles often produce geomagnetic storms when they reach the earth, producing aurora, and degrading MW and HF radio reception, for hours or even days.

DDS-60 Direct digital synthesizer

Recently I put together a DDS-60. DDS stands for Direct Digital Synthesizer. It is a way to generate arbitrary frequencies. Samples are fed to a D/A (Digital to Analog Converter) at a fixed clock rate (in this case 180 MHz derived from a 30 MHz oscillator). These samples are generated by a NCO (Numerically Controlled Oscillator). Think of it as a sine wave being generated point by point, at a fixed (depending on the ratio of the output frequency to the 180 MHz clock) number of degrees per sample. The output frequency can instantly be changed by just altering this degrees per sample value.

In the case of the DDS-60, any output frequency from 0 to 60 MHz can be generated. AD9851 DDS chip is used. This chip, along with a buffer/amplifier, low pass filter, and voltage regulator is all contained on a small (about one by two inch) board. The output amplitude is set by a small trimmer pot, with a maximum of about 4 volts peak-peak.

Three TTL level digital control lines are used to select the frequency. In my case, I have them connected to the parallel port of a PC.

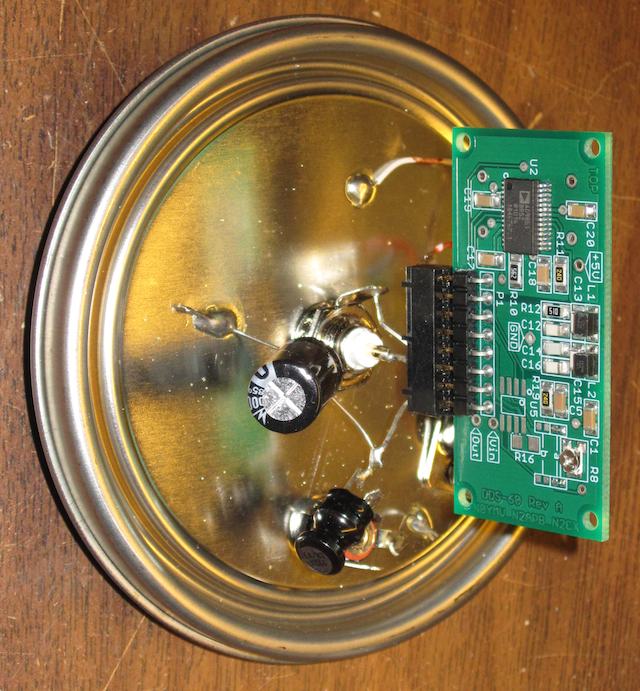
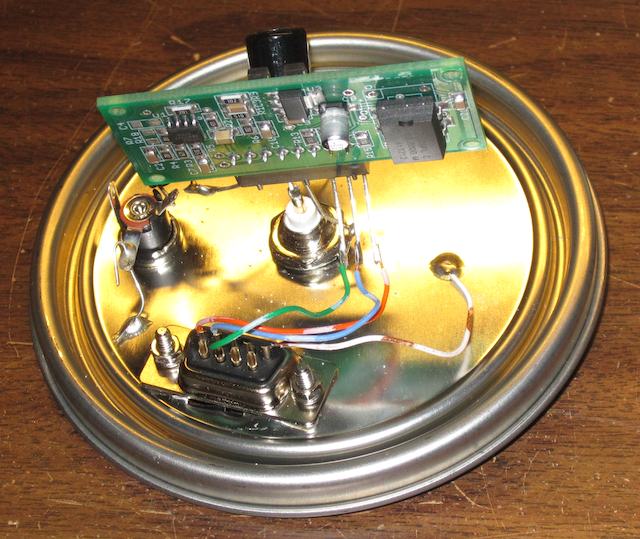
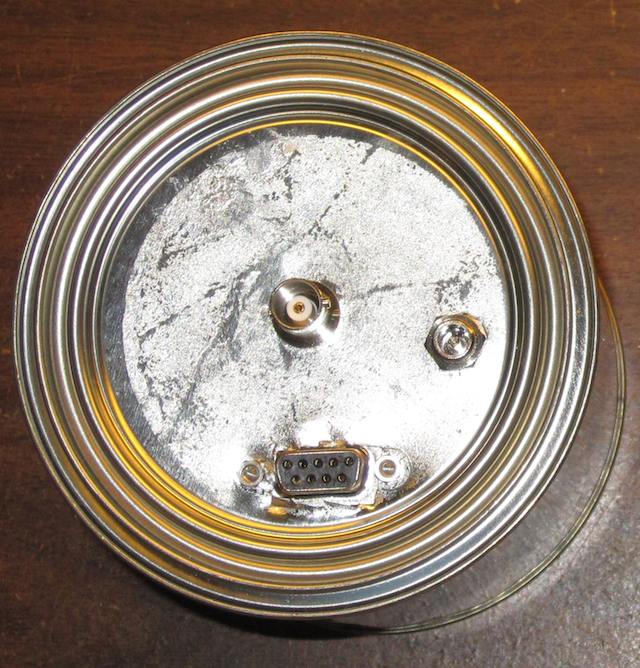
I mounted the DDS-60 on the underside of the lid of a one quart paint can. The output goes to a BNC connector, there is also a 2.5mm barrel jack for 12V DC power, and a 9 pin D-SUB connector for the digital lines to the PC:

DDS-60 Board
There is a small LC filter (about 3 mH and 1000 uF) on the incoming DC power line.

DDS-60 board

Here is the resulting unit. Ugly, but it works!
DDS-60 in tin can

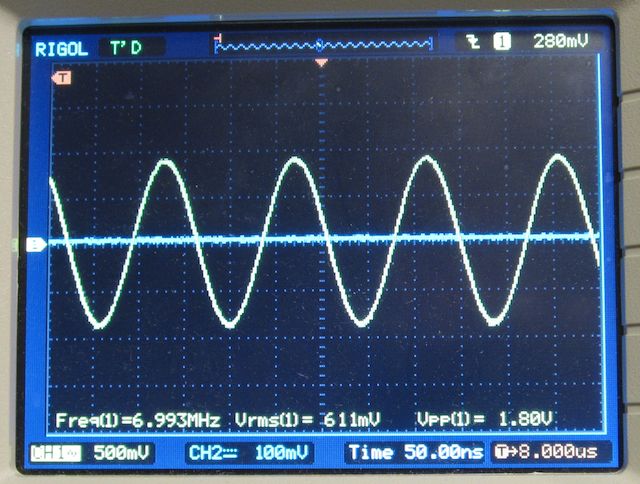
And here is the output on a scope:
DDS-60 output on an oscilloscope

So what can you do with a DDS?

First, it’s a very handy piece of gear for the RF test bench. You have a stable and precise source of RF that can cover the entire LF, MF, and HF bands. One of my next goals is to write some software to do automated testing and sweeps of RF, using an RF voltmeter as the input. I hope to blog about that shortly.

Second, you can use it as an exciter to drive an RF amplifier.

How many watts do you need?

Let’s say you’re a ham radio operator, or even a (gasp!) pirate radio broadcaster. How many watts of transmitter power do you need to reach your target(s)? Well, if you’re the typical ham, the answer is easy – just crank up the transmitter RF output knob to max. If you’re the typical pirate, you may do the same, although you’re a little more cognizant of the risks involved. Higher power is more likely to cause RFI issues with the neighbors’ TV, and possibly get you some unwanted attention from the FCC.

The alternative is to run low power. In ham lingo, this is called QRP. Most transmitters let you adjust your power level, so you can just dial it down. But to what level? How low can you go? What you’re trying to accomplish is to be heard by your listener(s). That is, the received signal is large enough to overcome noise levels, both from other signals and static, as well as receiver noise. The latter is a concern at VHF/UHF frequencies, but essentially a non-issue for HF, where atmospheric noise always dominates.

The signal to noise ratio (SNR) is defined as the ratio between the signal and noise levels, and is usually expressed in decibels (dB). 0 dB means the ratio is 1, the signal and noise power levels are the same. a 10 dB SNR means the signal power is 10 times the noise power, 20 dB means the signal is 100 times (it is a log based scale). These are for power values, for voltage ratios the SNR is twice the power value. A SNR of 0 dB would just be barely detectable, in practice you need a few dBs for even a weak signal, and a SNR of 30 or 40 dB is considered an excellent quality signal.

Noise levels vary tremendously, of course. Atmospheric noise varies with the frequency (higher at lower frequencies) and time of day (higher at night, when static from distant thunderstorms is more easily propagated). Then there are the potential man made sources of noise, such as other stations, as well as unintentional noise from the multitude of TVs, computers, switching power supplies, and so on, which have all contributed to a rise in the noise floor over the years.

There are many software tools to estimate received signal levels, based on transmitter power levels and propagation conditions, such as DX Toolbox. Plug in the numbers, and you can get an estimate of the received signal level. It might even be close – there are a lot of factors to consider, and many of them are unknowns, or at least estimates, such as solar effects on propagation.

Another way is to actually measure the received signal level. The good news is that most shortwave receivers have an s-meter, to tell you how strong a signal is. The bad news is that most of the time, the s-meter is wrong.

First, there is no concrete definition of how an s-meter should work. The ARRL suggestion is that an S9 signal is 50 microvolts at the antenna input, and that each S unit represents a 6 dB change in input voltage and power (that is, the voltage doubles, meaning the power level is 4 times higher). Tests on common receivers and transceivers show about a 1 to 5 dB per S unit change. That is, each increase in indicated signal level on the s-meter actually represents a smaller change in received power level, as compared to the theoretical 6 dB/S unit standard.

All other things equal, a change in transmitter power level causes a corresponding change in received power level. So if you double your transmitter power, the received signal will also double. According to the ARRL standard, increasing the transmitter power by a factor of 4 would add one S unit, in practice with most receivers it would add several S units, depending on what the original received signal level was. Again, the s-meter is just an indicator, the actual received signal level is what is important. Doubling the transmitter power will increase the signal, and SNR, by 3 dB. Likewise, cutting it in half will reduce the SNR by 3 dB.

So, let’s assume we have a transmitter running at 150 W (a pretty reasonable value for a good old fashioned tube rig like a Johnson Viking II). And let’s assume that the received s-meter reading is S9 dB, a very good signal, and it’s nighttime with a noise level, as indicated on the s-meter, is S4.

Here’s the Icom IC-730 S-meter sensitivity values from the previous link I gave:
S1 - 2 1.4 dB
S2 - 3 1.3 dB
S3 - 4 1.6 dB
S4 - 5 2.3 dB
S5 - 6 1.8 dB
S6 - 7 3.2 dB
S7 - 8 3.1 dB
S8 - 9 4.0 dB
S9 - S9+10dB 5.6 dB
S9+10dB - S9+20dB 7.3 dB
S9+20dB - S9+30dB 6.6 dB
S9+30dB - S9+40dB 10.5 dB
S9+40dB - S9+50dB 11.3 dB
S9+50dB - S9+60dB 13.5 dB

Ok, so let’s see what happens as we reduce the transmitter power. Each time we cut it in half, we reduce the received signal by 3 dB. Reducing it to a quarter would be 6 dB, an eight would be 9 dB, and a tenth would be 10 dB. Got it?

Looking at the chart, going from S8 to S9 is a 4 dB change. That would correspond with reducing the transmitter power by a factor of 0.40, or down to 60 watts. Going from S8 to S7 is 3.1 dB, a power reduction to 0.49, or 29.4 watts. S7 to S6 is 3.2 dB, a factor of 0.48, or down to 14.1 watts. S6 to S5 is a factor of 1.8 dB, 0.66, or 9.3 watts. And finally S5 to S4 is 2.3 dB, a ratio of 0.59, or down to 5.5 watts.

So what does all this mean? Well, if we dropped our transmitter power from 150 watts to 5.5 watts, the received signal would drop from S9 to S4. We stopped there because the noise levels were S4. At this point, the signal is barely audible. At 9.3 watts, pretty close to the magic 10 watts that most grenade type transmitters put out, the received signal is S5, one S unit above the S4 noise, 2.3 dB above, so an SNR of 2.3 dB. Something you could listen to, but it would really be down in the noise.

What about the original 150 watts that produced an S9 signal? Well, let’s just add up our dBs. 2.3 + 1.8 + 3.2 + 3.1 + 4.0 = 14.4 dB. So in this case, the SNR is 14.4 dB. Not the 20 or 30 dB you’d expect from say the BBC, but certainly pleasant enough to listen to.

Obviously this is just one example. With different assumptions, especially noise levels, the results will be different. Much lower noise levels would allow weaker transmissions to be heard. If the noise was S1 instead of S4, that’s 4.3 dB of SNR right there. Likewise, higher noise levels intuitively imply more transmitter power is necessary. But I think these are reasonable assumptions for nighttime noise levels on 43 meters, and typical pirate transmitter power levels.

The numbers speak for themselves. The difference between the received SNR for a 150 watt and 10 watt transmitter is huge. Of course, as the difference between getting the knock and not is also huge. Assuming transmitter power levels have an influence on FCC enforcement activity…

A 30 mW unlicensed CW beacon was busted last year:
Last summer the F.C.C. DFed the Echo beacon that was on 11002 Khz. It had been running 30mW.
The FCC agent was kind and considerate and dropped further investigation. In fact he was respectful of the fact that it was
completely Homebrew and will under 100mW. There was no complaint
and the only one who cared about the beacon was the DF site in Maryland. The little beacon was disconnected and dismantled.
The operators pirate beacon days are over.

20 to 30 mW is extremely lower power, even for CW. This tells us two things: first, the FCC has very good ears, and can pick up weak signals. If they can pick up a 20 mW beacon, they can easily pick up your 10 watt grenade. Second, and more importantly, they are probably more concerned with the frequency the unlicensed station is using, than the number of watts. If you look through recent busts of pirates, you will see that they are mostly due to choice of frequency, as well as the unusual bust of Weather Radio, which appears to have been motivated by their use of the National Weather Service’s DECtalk speech synthesizer voice.

This is not to say that transmitter power plays no role. But it may not be the FCC’s primary enforcement trigger. The FCC is Complaint Driven. A scan through their Enforcement Bureau confirms this. Busts are mostly for FM pirates, likely based on complaints from licensed stations, as well as for other offending transmissions, such as those that interfere with cellular phone service.

Busts of HF pirates would also likely be due to complaints from licensed services, especially the military, which does use parts of 43 meters. Those BLEEP BLEEP BLAPPP sounds you hear are the TADIL-A/Link 11 system. I can imagine that 70s pop music or cut and paste audio loops interfering with them don’t go over well with the men in uniform. One call is all it takes for the offending pirate to suddenly be #1 on the FCC’s enforcement list.

Back in the 1990s, The infamous pirate Voice of the Night, operated by Lad, was QRMing a Havana/Moscow CW net on 7415 kHz. The operators could often be heard sending strings if FUFUFU in CW in response. Apparently it also annoyed certain radio monitors employed by No Such Agency, as Lad was quickly busted.

So worry about how many watts you’re sending into the ether, but also worry about your choice of frequency.

Antennas Antennas Antennas

I’ve been an SWL for 30+ years now. In that time, I’ve had probably dozens of HF antennas. My first was a simple Random Wire (aka longwire), about 75 ft long, going from the shack (my second story bedroom as a kid) to a tree. Fed with single conductor wire to the antenna input of my Radio Shack DX-160. It worked reasonably well, I heard lots of stations, and back then there were far fewer sources of QRM in the house. We didn’t have computers or plasma TVs to deal with, nor dozens of switching power supplies. Just horizontal sweep harmonics from TV sets and the occasional dimmer switch.

Eventually, I discovered dipole antennas. By this time I was in to listening to pirate radio stations, so I put one up cut for about 7400 kHz, since that is where most pirates were operating. Dipoles are inherently narrow band antennas, and I eventually had several including one cut for around 6200 kHz for Europirates, since that is where they tended to operate. This was a folded dipole made from standard 300 ohm TV twinlead. The ends were shorted, and a 4:1 balun was connected to the center of the lower conductor, since the antenna was theoretically 300 ohms impedance. From memory, this antenna worked very well.

At one point, when I was more involved with ham radio, I put up a G5RV antenna. I don’t recall spectacular results with it. I spent most of my time on 15 meters CW, so I ended up putting up a 15 meter band dipole, which worked quite well as expected. I had a lot of contacts with Latin America.

Several years ago, I discovered the terminated, tilted, folded dipole (T2FD) antenna. This is a very broadband antenna, with a typical claimed bandwidth ratio between highest and lowest frequency of about 5:1. In my case, I put up a 132 ft long T2FD, which was designed for about 2.5 to 15 MHz. This was at the bottom of the sunspot cycle, so higher frequencies were not of much interest. (Of course, several years later, we still seem to be at the bottom of the solar cycle) This antenna was fed with 75 ohm coax into a 9:1 balun. I got very good results with it for HF, and it worked reasonably well down to the upper end of the MW broadcast band. Performance was very poor, as expected for the rest of the MW band and for longwave.

One thing I immediately noticed about this antenna, vs the various dipoles I had, was that the very low noise. It did not seem to pick up QRM as much as the dipoles. Signal levels of stations were also lower, but, more important, signal to noise ratios were higher. There has been a lot of speculation and claims about the low noise characteristics of various forms of loop antennas. This may explain the excellent results I had years ago with my folded dipole for 6200 kHz.

I finally had an antenna that worked well over most of HF, which meant that rather than switching in various dipoles depending on where I wanted to listen, I could just leave the one antenna connected. Plus I had generally lower noise levels. But I did not have something that worked well down into the MW band.

The next antenna I discovered was the sky loop antenna. The sky loop is a giant loop antenna in the horizontal plane. You run it as high as you can, often around the perimeter of your yard. The exact shape is not important, in my case there are about a dozen or more supports around the various sides of the antenna, and it most closely resembles a trapezoid in shape, with a perimeter of about 635 feet. Yes, it’s a huge antenna. MW reception is excellent as expected, semi-local MW stations are in the S9+60 dB range.

My T2FD was damaged in a storm around the time the sky loop was installed. I hope to get it back up shortly, to run some better comparisons between the two antennas. Also, the T2FD may be better for the higher bands. Should solar activity return to reasonable levels, I may install a shorter T2FD for 19 to 10 meters.

Based on my recent experience, I am certainly sold on loop antennas in their various forms. The lower noise pickup characteristics are reason enough to consider building one the next time you’re considering putting up a new antenna.

netSDR from RF Space

A few months ago, I got a new radio – a netSDR from RF Space. I’ve had an SDR before, the SDR-14, also from RF Space. The major difference between the two is the maximum bandwidth. The SDR-14 used a USB interface, and was limited to 190 kHz. The netSDR, which uses an ethernet interface, has a maximum bandwidth of 1.6 MHz. In other worse, you could record the entire MW band.

netSDR receiver from RF Space

Think of an SDR as a fast A/D (analog to digital converter) connected to your antenna. In the case of the netSDR, it is sampling at 80 MHz, which allows a theoretical maximum frequency of 40 MHz (half the sampling rate) to be received. In practice the maximum frequency is less than half, due to non ideal filters, 32 MHz in the case of the netSDR.

The A/D output is then mixed in quadrature with the NCO (numerically controlled oscillator, which sets the center frequency), and fed through various filters and decimators in the netSDR, reducing the sampling rate and bandwidth. For example, if the NCO is set to 6900 kHz, and the final bandwidth is 200 kHz, the output of the SDR will represent 6800 to 7000 kHz. In quadrature means that two NCO signals are used, both at the same frequency but 90 degrees out of phase with each other. This is often referred to as I/Q data. This data is sent to the computer over ethernet, where the application software uses various DSP (digital signal processing) routines to further filter and then demodulate it.

Generally, an SDR is used in two ways. First, you can use it like a normal radio. The output of the SDR is mixed as necessary with another NCO to produce a final center frequency equal to that of the station you want to listen to. This is then filtered to the desired bandwidth (comparable to the IF bandwidth of an analog receiver) and demodulated. All of this is done in software, of course, after the initial A/D conversion.

Second, you can display a waterfall of an entire chunk of the RF spectrum, allowing you to see what frequencies are in use. For example, you could look at 6800-7000 kHz (or even wider) and instantly spot a pirate station as soon as they go on the air. Likewise, with the 1.6 MHz bandwidth, you can look at the entire MW band (heck, LW as well) at the same time. Or almost the entire 10 meter ham band.


Waterfall scan of the entire MW broadcast band

You also could demodulate multiple stations at the same time, as long as they are all within the bandwidth of the I/Q data being sent from the SDR to the computer. In theory, if your computer was fast enough, you could demodulate every single channel in the MW band at the same time.

Pirates reported on August 28, 2011

Here’s what folks on the HFUnderground.com have reported hearing yesterday:

MAC Shortwave / Ultraman 6924.5 kHz AM from 0000 UTC. Lots of Elvis music.

Northern Relay Service 6930 kHz AM at 0230 UTC.

Radio True North – 6925 kHz AM from 0321 past 0343 UTC.

Renegade Radio 6925 kHz USB from 0127 until past 0225 UTC. Songs included Rosanna, Too Much Time on My Hands, Take The Long Way Home.

UNID 6925 kHz USB from 0140 past 0210 UTC. Started out in AM and then switched to USB.  1920s music including Putting On The Ritz.