Winter 2015-2016 Snowfall

Saturday December 19, 2015:
Trace snow.

December Total: Trace

2015-2016 Season Total: Trace

Monday January 4, 2016:
Flurries.

Tuesday January 12, 2016:
0.3″

Sunday January 17, 2016:
0.2″

Wednesday January 20, 2016:
0.3″

Friday January 22, 2016 – Saturday January 23, 2016:
28.0″

January Total: 28.8″

Friday February 5, 2016:
A dusting of snow while temperature were above freezing.

Tuesday February 9, 2016:
7.5″ as of 11:00 AM. Fairly wet and heavy snow. Above freezing for much of the time it fell.
Then 2.8″ in the evening for a total of 10.3″.
Some earlier pictures:


Friday February 12, 2016:
1.0″ of very light and puffy snow, I was able to clear the driveway with the leaf blower.

Monday February 15, 2016:
1.0″ of snow, later changing to sleet and some light freezing rain.

Thursday February 25, 2016:
Snow flurries.

Friday February 26, 2016:
Snow flurries.

February Total: 12.3″

Friday March 4, 2016:
1.6″ of snow.

Sunday March 6, 2016:
A dusting of snow.

Saturday March 19, 2016:
0.5″ of snow.

March Total: 2.16″

Sunday April 3, 2016:
A dusting of snow during a strong wind event.

Friday April 8, 2016:
Snow flurries.

Saturday April 9, 2016:
0.5″ of snow, also some graupel.

April Total: 0.5″

2015-2016 Season Total: 43.7″

Cocoa1090 Mode S (ADS-B) aircraft transponder decoder for Mac OS X

Cocoa1090 is a Mode S (ADS-B) aircraft transponder decoder for Mac OS X, written for use with RTL-SDR devices (RTL based USB tuner dongles). These transmissions are at 1090 MHz, and can be received at a distance of a few hundred miles, often even with a modest antenna.

Cocoa 1090 uses rtl_tcp, part of the free RTL-SDR package, to control the RTL device, and produce I/Q data.

Some tips for installing RTL-SDR are here: http://www.hfunderground.com/wiki/RTL-SDR

Cocoa1090 displays all received aircraft, including the altitude, heading, speed, and flight number, as well as the tail number and aircraft model (if it is part of the included database, you can add your own tail numbers). Some transponders include position information, this is also displayed if received, and used to map those planes (Click on the image below to see it full size):

Cocoa 1090 is free, a copy can be downloaded from the website: http://www.blackcatsystems.com/software/cocoa1090.html

Receiving DGPS Stations with MultiMode For Mac OS X

MultiMode for Mac OS X can decode DGPS (Differential Global Positioning System) transmissions. DGPS stations transmit the difference between positions indicated by GPS satellite systems and the known fixed position of the station. This allows higher accuracy. DGPS transmissions are 100 or 200 baud and are transmitted on frequencies from 285 kHz to 325 kHz. They can be interesting DX targets.

A copy of MultiMode can be downloaded here: http://www.blackcatsystems.com/download/multimode.html

To decode the transmission, tune your radio to a DGPS frequency. You can either tune directly to the frequency in CW mode, in which case you set the center frequency in MultiMode to that for your radio’s CW mode, or use USB mode, tune 1 kHz low, and set the center frequency to 1000 Hz.

You can listen to an example DGPS audio recording

Select the baud rate, either 100 or 200 baud, using the button. Also be sure to set your location so that the correct distance and bearing is calculated. Eventually, if you have tuned into a DGPS transmission that is strong enough, you will start seeing decode messages printed:

The Short Demod button can be toggled on, in which case MultiMode will look at a smaller part of the DGPS packet. This often allows decodes of weaker transmissions.

Note that since no error checking is performed on the packet, it is possible to get false decodes. To help determine if you are actually receiving the correct station, compare the printed frequency for that station to what your radio is tuned to, to verify they match. Also look for several decodes from the same station in a row, that indicates that you probably are really receiving that station.

Here’s a list of some stations I have received here with a modest 200 ft random wire antenna:

[15:44:47 11/19/15] 008 804 008 009 286.0 kHz Sandy Hook, NJ United States 40.4747 -74.0197 235.632 km 45.2895 deg
[19:27:49 11/19/15] 198 772 198 199 306.0 kHz Acushnet, MA United States 41.7492 -70.8886 529.571 km 53.1416 deg
[19:28:52 11/19/15] 190 782 190 191 305.0 kHz Dandridge, TN United States 36.0225 -83.3067 723.745 km 245.071 deg
[19:29:12 11/19/15] 156 863 156 157 311.0 kHz Rock Island IL United States 42.0203 -90.2311 1245.06 km 290.156 deg
[19:32:00 11/19/15] 012 806 012 013 289.0 kHz Driver, VA United States 36.9633 -76.5622 231.719 km 192.449 deg
[19:33:00 11/19/15] 184 788 184 185 291.0 kHz Hawk Run, PA United States 40.8889 -78.1889 280.839 km 319.079 deg
[19:33:24 11/19/15] 006 803 006 007 293.0 kHz Moriches, NY United States 40.7944 -72.7564 340.978 km 53.1725 deg
[19:33:37 11/19/15] 196 771 196 197 294.0 kHz New Bern, NC United States 35.1806 -77.0586 434.825 km 192.789 deg
[19:33:50 11/19/15] 092 843 092 093 295.0 kHz St Mary's, WV United States 39.4381 -81.1758 448.281 km 277.867 deg
[19:33:54 11/19/15] 136 792 136 137 297.0 kHz Bobo, MS United States 34.1253 -90.6964 1414.92 km 252.075 deg
[19:33:59 11/19/15] 058 847 058 059 301.0 kHz Annapolis, MD United States 39.0181 -76.61 52.734 km 272.373 deg
[19:36:40 11/19/15] 046 824 046 047 303.0 kHz Greensboro, NC United States 36.0694 -79.7381 463.251 km 226.48 deg
[19:40:01 11/19/15] 218 777 218 219 304.0 kHz Mequon, WI United States 43.2025 -88.0664 1110.64 km 298.697 deg
[19:41:11 11/19/15] 130 834 130 131 307.0 kHz Hagerstown, MD United States 39.5553 -77.7219 160.52 km 293.159 deg
[19:43:59 11/19/15] 312 929 312 313 296.0 kHz St Jean Richelieu, QC Canada 45.3244 -73.3172 736.38 km 16.5642 deg
[19:44:05 11/19/15] 154 862 154 155 322.0 kHz St Louis, MO United States 38.6189 -89.7644 1190.3 km 272.301 deg
[19:55:36 11/19/15] 112 836 112 113 292.0 kHz Cheboygan, MI United States 45.6556 -84.475 1013.8 km 319.521 deg
[20:32:19 11/19/15] 017 808 016 017 314.0 kHz Card Sound, FL United States 25.4417 -80.4525 1560.45 km 196.764 deg
[20:34:44 11/19/15] 340 942 340 341 288.0 kHz Cape Ray, NL Canada 47.6356 -59.2408 1650.3 km 49.1252 deg
[22:10:54 11/19/15] 168 869 168 169 290.0 kHz Louisville, KY United States 38.0175 -85.31 816.337 km 265.238 deg
[22:11:34 11/19/15] 192 778 192 193 292.0 kHz Kensington, SC United States 33.4906 -79.3494 681.801 km 207.126 deg
[22:20:26 11/19/15] 320 925 320 321 313.0 kHz Moise, QC Canada 50.2025 -66.1194 1464.05 km 28.7438 deg
[11:34:56 11/20/15] 262 881 262 263 302.0 kHz Point Loma, CA United States 32.6769 -117.25 3697.45 km 272.2 deg

Seasonal Pirate Radio Stations

Tune into the 43 meter pirate radio band, which is roughly 6800 to 7000 kHz, but 6925 kHz in particular, on any given evening, and you’re likely to hear one or more broadcasts. While many stations transmit throughout the year, there are a few seasonal stations that you will only hear on certain days. To help you keep track of these stations, here’s a short summary of the more widely reported seasonal pirates. Note that the schedules of pirate radio stations are very flexible, and often broadcasts of these seasonal stations will be heard on a nearby weekend instead of the actual holiday, when there are usually more listeners.

I’ve also included QSLs from some of the stations.

WMLK – Recordings of speeches by Martin Luther King Jr, usually around his celebrated birthday, the next is January 18, 2016.

Voice of Pancho Villa – Heard during the time the NASWA Winter SWL Fest, which is usually in February.

WPDR Presidents’ Day Radio – Heard around Presidents’ Day with recordings of speeches by various Presidents. In 2016, Presidents’ Day is February 15.

Frederic Chopin Radio – Plays classical piano music, heard on our around his birthday of March 1.

XEROX – A classic parody of a Mexican radio station, usually on the air April Fools Day (April 1).

Radio Cinco De Mayo – Heard on or around the Mexican Holiday on May 5.

KHAQQ / Amelia Earhart Often heard on or around July 3, with simulated communications between ground station NRUI and Earhart (KHAQQ), trying to locate her.

Radio Paisano – A program of Italian related music which airs around Columbus Day, which is next observed October 10, 2016.

Halloween themed stations – Lots of stations are heard around Halloween, here’s several of the most active:
Peskie Party Halloween
Pumpkin Patch Radio
Radio Halloween
Satan Radio
The Great Pumpkin
WAHR Automated Halloween Radio
Witch City Radio


Edmund Fitzgerald Radio – Commemorates the sinking of the ship with the Gordon Lightfoot song as well as recordings of marine communications. Heard on November 10.

WJFK – Usually on the air around day of President Kennedy’s assassination, November 22. Traditionally, the station plays these three songs:
“Abraham, Martin & John” by Dion
“Sunny” by Bobby Hebb
“PT-109” by Jimmy Dean

Another variant has appeared in recent years, which plays recordings of news announcements of the assassination.

D. B. Cooper Radio – Heard on or around the day before Thanksgiving.
Related to the hijacking of a Boeing 727 on Wednesday, November 24, 1971.

Turkey Breast Radio – Heard on or around Thanksgiving.

Happy Hanukkah Radio – Heard during the eight days of Hanukkah. Usually the following is heard:
“Miracle of Miracles” from Fiddler on the Roof
“Hava Nagila” by the Effi Netzer Singers
“2000 Year Old man” skit by Mel Brooks.

Christmas themed stations – Another popular holiday for pirates:
Fruitcake Station
NOEL
Radio Jingle Bells
Snowball Radio

Irregular stations:

WUBR Ultimate Blizzard Radio – Occasionally heard during major snowstorms.

Victory Radio – Heard when University of Texas wins a football game.

Poor conditions for some on 43 meters last night, better for others

One measure of the strength of the ionosphere is called foF2. It is the maximum frequency that will be reflected straight back. That is imagine the radio transmitter and receiver are located near each other, the radio waves go straight up, and are reflected straight back down to the receiver. foF2 is continuously varying, based on solar activity, and what part of the Earth the Sun is over. You can find a real time map at this URL: http://www.spacew.com/www/fof2.gif

As the distance between the transmitter and receiver increases, the radio waves are not perpendicular to the ionosphere, but instead strike it at an angle. This allows frequencies higher than foF2 to be reflected. The angle that the radio waves strike the ionosphere depends on the distance between the transmitter and receiver, and the height of the ionosphere, which unfortunately also varies. This is called the hmF2, and there’s a real time map of it also: http://www.spacew.com/www/hmf2.gif

The Maximum Usable Frequency (MUF) can be found by:
MUF = foF2 * sqrt( 1+ [D/(2*hmF2)]^2) where D is the distance in km.

Lately, foF2 has been reaching very low values once the Suns sets. This is what causes the 43 meter band to “go long”, making it difficult to impossible to hear stations even many hundreds of miles away. As an example, here is a plot of the measured foF2 value taken over Wallops Island, VA. Consider these values typical for much of the eastern US during this time period:

The blue trace is today’s foF2 values, red is yesterday’s, and the green trace is an average of the last five days.

foF2 was about 5 MHz at 2300z, dropping to 4.5 MHz by 0000z. This was evident in the loggings for The Crystal Ship. Many listeners who normally get a strong signal from this station had poor or no reception (as was my case). This was also the start of a geomagnetic storm, the K index at 0000z was 3, and has since risen to 5 as I type this.

The flip side of a low foF2 value is that listeners at a greater distance from a station can get stronger signals. The geomagnetic storm last night could also have actually enhanced reception for some listeners. Medium wave DXers have referred to geomagnetic storms as “stirring the gumbo”, bringing in a different mix of station than are normally heard.

Update – here is the link to the real time Wallops Island foF2 chart: http://www.ngdc.noaa.gov/stp/IONO/rt-iono/realtime/WP937_foF2.png and the current graph itself:

Winter 2014-2015 Snowfall

Thursday November 13, 2014:
0.5 inch snow.

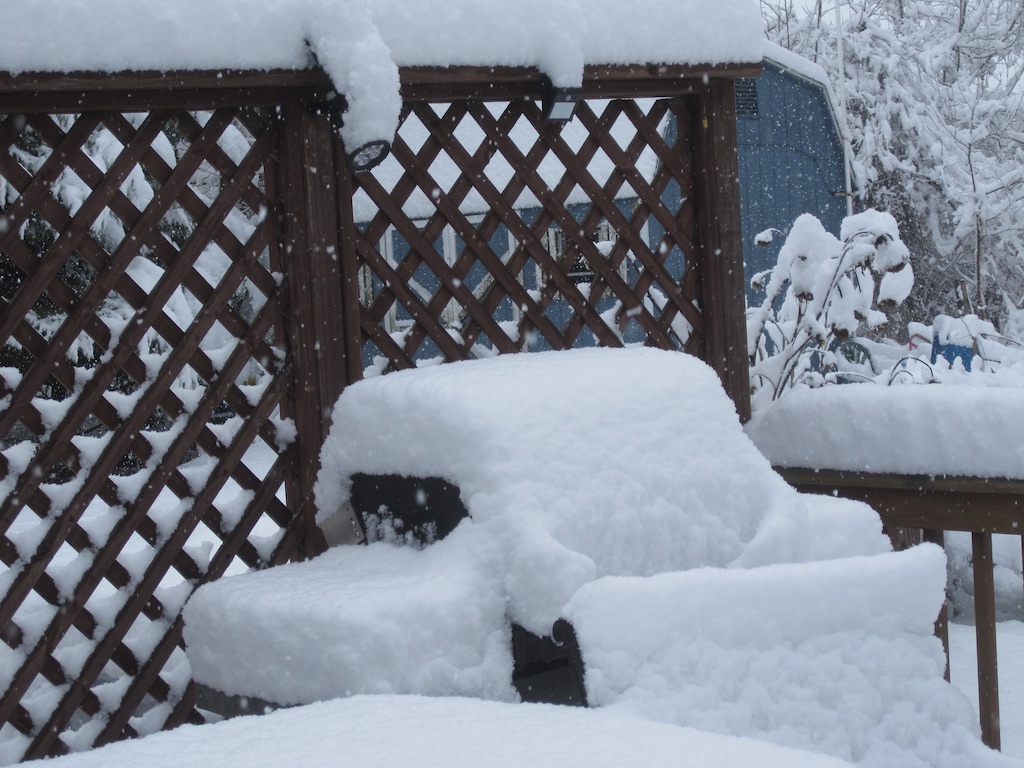
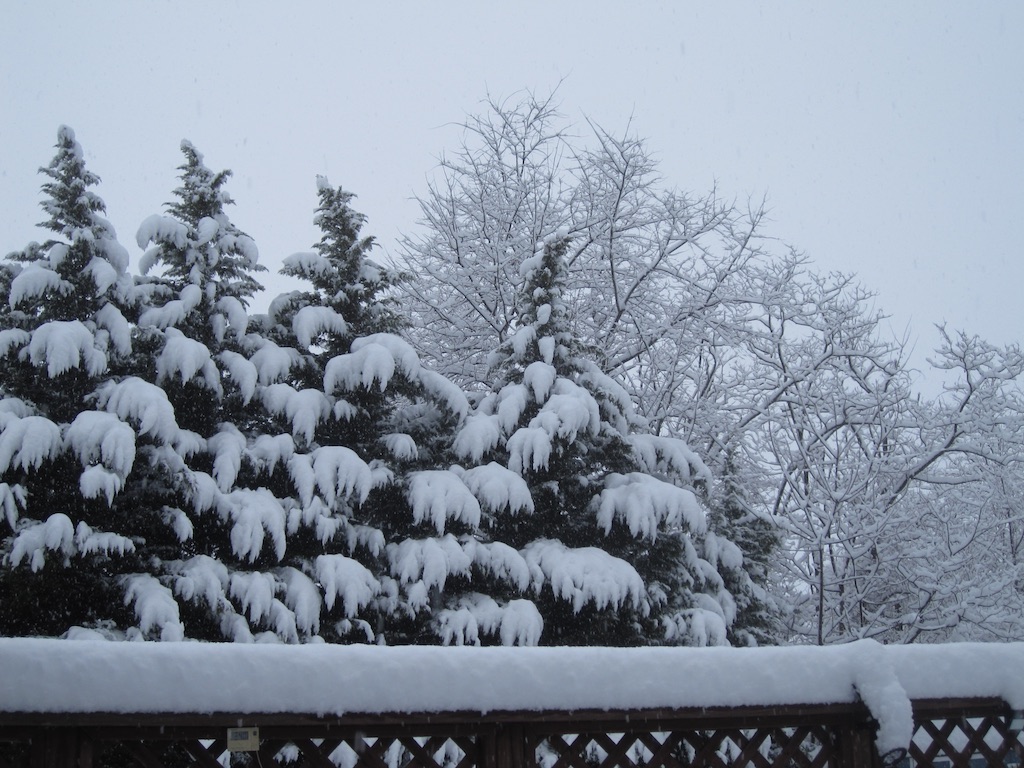
Wednesday November 26, 2014:
0.56 inch of rain, changed to snow early morning
3.9 inch snow.
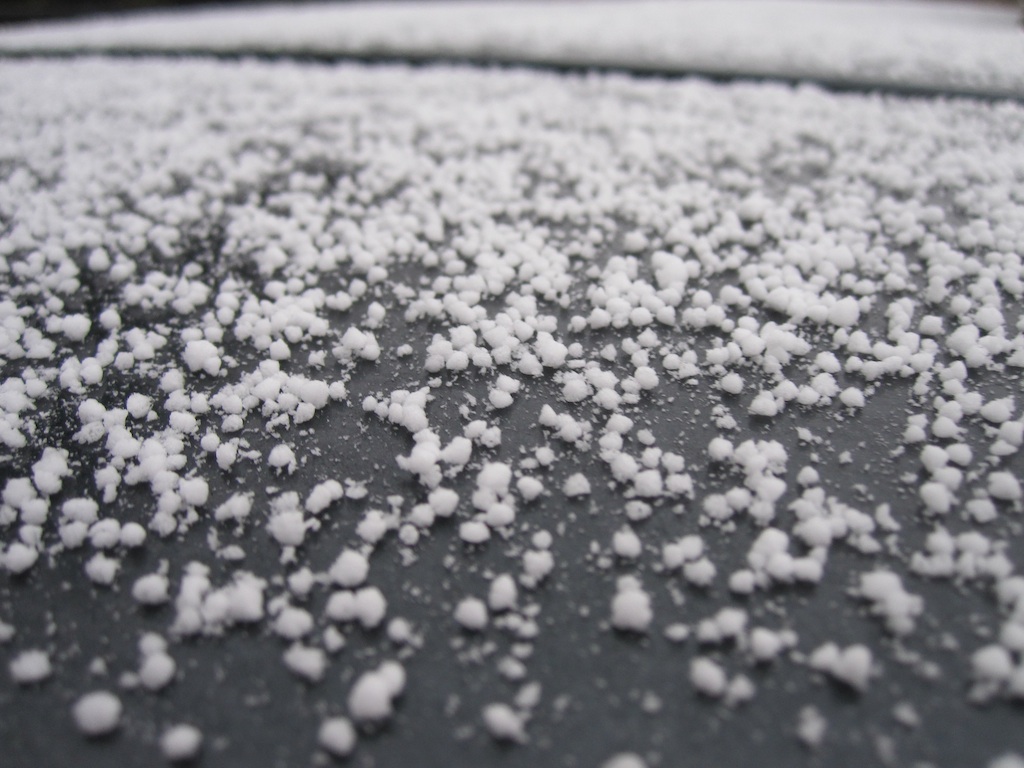
Changed to graupel as it was ending.

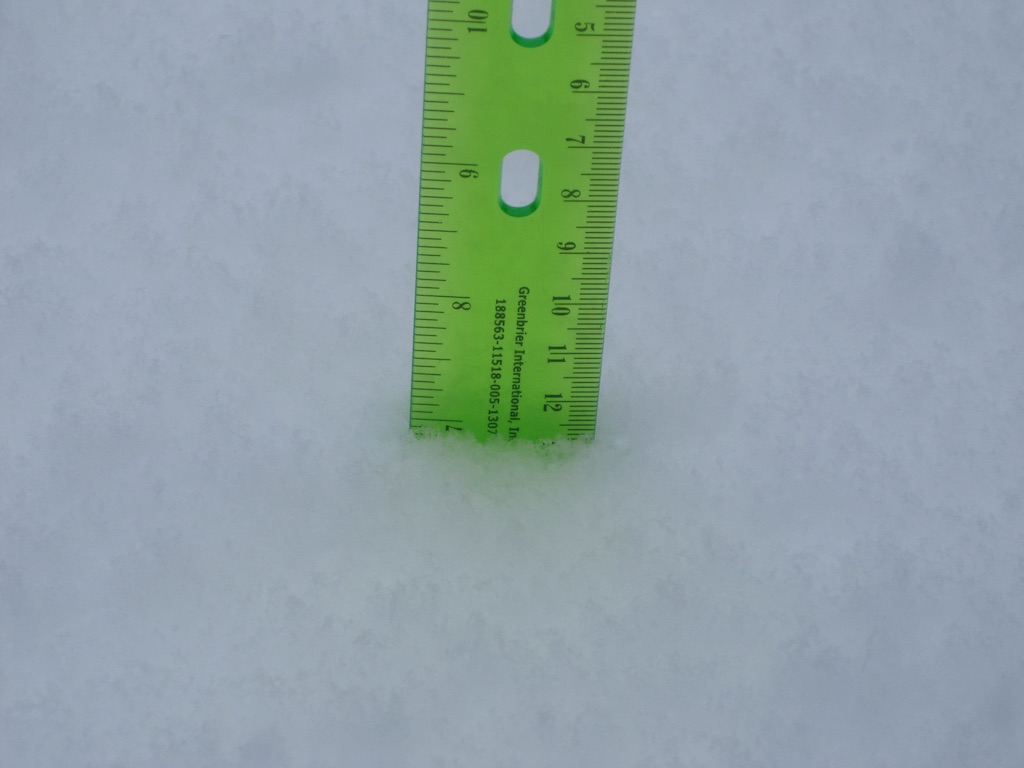
Science experiment with the kids:

We cut a block of snow from outside, 12.5 by 9 by 7.5 cm, and computed the volume: 843.75 cm3. We shaved the top to make sure it was even.

Then we took the snow and weighed it, and came up with 160g.

We melted the snow and measured the volume, and got 160 ml (nice to see the agreement).

Then we computed the snow to liquid ratio: 843.75/160=5.27.

Our measured snow depth here was 3.9 inches, so that is 0.74 inches liquid. We got 0.56 inch of rain before it switched to snow. So rather impressive 1.3 inches of liquid total.

Saturday November 29, 2014:
0.3 inch of snow from a quick dusting.

November Total: 4.7 inches

Tuesday December 2, 2014:
0.54 inch of rain.
0.2 inch of snow/sleet.

Monday December 8, 2014:
Snow flurries.

Tuesday December 9, 2014:
0.1 inch freezing rain.

Wednesday December 10, 2014:
Snow flurries in the evening.

Thursday December 11, 2014:
Snow flurries and light snow throughout the day, 0.25 inch total accumulation.

December Total: 0.45 inches

Monday January 5, 2015:
Snow flurries in the morning.

Tuesday January 6, 2015:
3.0 inches of snow.

Wednesday January 7, 2015:
0.3 inches of snow.

Monday January 12, 2015:
0.1 inch of freezing rain.

Wednesday January 14, 2015:
0.2 inches of snow.

Monday January 19, 2015:
Dusting of snow.

Wednesday January 21, 2015:
3.5 inches of snow.

Friday January 23, 2015 – Saturday January 24, 2015:
1.25 inches of snow.

Monday January 26, 2015 – Tuesday January 27, 2015:
1.9 inches of snow.

Thursday January 29, 2015
0.25 inches of snow.

January Total: 10.4 inches

Monday February 2, 2015
1.0 inches of snow/sleet/rain/etc.

Monday February 9, 2015
Crunchy coating of snow, sleet, freezing rain.

Thursday February 12, 2015
0.1 inches of snow.

Saturday February 14, 2015
0.5 inches of snow.

Monday February 16, 2015 – Tuesday February 17, 2015
2.5 inches of snow.

Wednesday February 18, 2015
0.1 inches of snow.

Thursday February 19, 2015
A dusting of snow.

Saturday February 21, 2015
7.25 inches of snow.

Thursday February 26, 2015
0.2 inches of snow.

Friday February 27, 2015
0.25 inches of snow.

February Total: 11.90 inches

Sunday March 1, 2015
1.0 inch of snow, followed by sleet and about 0.1 inch of freezing rain.

Tuesday March 3, 2015
0.1 inch of freezing rain.

Thursday March 5, 2015
13.25 inches of snow.

Friday March 20, 2015
3.0 inches of snow.

Tuesday March 24, 2015
Dusting of snow.

March (to date) Total: 17.25 inches snow, 0.1 inch ice

Season To Date Total: 44.70 inches

A Statistical Analysis of A Somewhat Subjective Rating of the Day’s Weather

Below is an analysis of the Capital Weather Gang’s “Daily Digit”, a number from 1 to 10 given each morning to the day’s expected weather. 574 days worth of Daily Digits were analyzed, from March 19, 2013 through October 13, 2014. The starting date was picked as that was the first date where it was easy to get a copy of the CWG’s archived web pages.

The mean daily digit was 6.32.

Below is a trend graph of the Daily Digit, smoothed slightly to make it more readable:

The slope upwards over time could be an artifact of the range of dates chosen, or it could be genuine Daily Digit Inflation.

Below is a histogram of the Daily Digit values:

There were only five days with a Daily Digit of 1; they were:

June 13, 2013 – David Streit (Severe weather)
December 9, 2013 – Jason Samenow (“Sloppy, cloudy and cold”)
December 29, 2013 – Brian Jackson (“40s and soaking rain in December”)
January 3, 2014 – A. Camden Walker (Icy from snow the night before)
January 28, 2014 – Matt Rogers (“Cruel cold slaps us in the face again”)

The mean Daily Digit per month of the year:

The mean Daily Digit per day of the week:

The mean Daily Digit per author:

There is a fairly regular rotation of authors, each generally writing on the same day, hence the strong correlation between the above two graphs. Each author had between 73 to 81 posts.

Not included in the above were the following two authors with a limited number of Daily Digits:
Kathryn Prociv: 10 entries with a mean of 8.3
Rick Grow: 8 entries with a mean of 5.0

There were also a few cases where two authors were credited the same day, also not included above:
Matt Rogers;Jason Samenow: 3 entries with a mean of 3.33
Brian Jackson;Dan Stillman: 2 entries: with a mean of 3.5
A. Camden Walker;Ian Livingston: 1 entry with a mean of 2 (January 10, 2014, Freezing Rain)
Dan Stillman;Ian Livingston: 1 entry with a mean of 4 (February 15, 2014, Snow)
Dan Stillman;Jason Samenow: 1 entry with a mean of 3 (February 26, 2014, “Mother Nature hits the repeat button with light morning snow”)

A big thanks to the Capital Weather Gang for their fabulous posts each day!

Update:

Here’s histograms for each author:


Old Time Radio – Shortwave Pirate Radio Station Or Something Else ?

For about the past three weeks, we’ve had a bit of a mystery on the 43 meter pirate shortwave broadcast band. First logged on the HFUnderground on May 18, 2014 on 6772.6 kHz by EvilElvis as an UNID pirate playing “Tooth Powder commercial, 5 Minute Mystery, Red Skelton, Avalon Cigarettes commercial”, this station has been heard nearly non-stop since then, except for some short breaks, and a two day period between June 3 (it was last heard on June 2 at 2357 UTC and returned by 0035 UTC on June 5.

This station has been heard from coast to coast, and has a over 170 loggings on the HFUnderground Pirate Shortwave Radio Forum and has become quite the favorite of many shortwave pirate radio listeners. Many of us where disappointed when we turned on our radios on June 3 to just hear static, and equally thrilled to hear the station again when it returned two days later. I’m hearing it on 6772.6 kHz as I type this at 1323 UTC on June 6, 2014. It generally operates close to 6772 or 6773 kHz, but as also been heard on 6800 and 6880 kHz.

Possibly the same station was reported in the 13.56 MHz HiFer band previously. Glenn Hauser first logged it on 13560.7 AM on April 18 at 0520 UTC, and mentioned the following to me via email:

I haven`t heard it on any of the 6 MHz frequencies, but I keep wondering if it`s the same one I have reported thrice on 13560+. That would be 2 x 6780+ if that was ever a fundamental. Looking thru the posts (not sure I saw all of them) I don`t see anyone referring to that or to the webcast ID I heard from the 1920s Radio Network out of WHRO in Virginia. Should compare the programming to their schedule. They also have a separate mostly-music channel. 13560 was also pointed out to be a part 15 RF ID frequency which be some connexion.

The 1920s Radio Network has a website.

The general format seems to be playing music (often described as easy listening music, or even elevator music) during the daytime, and then old time radio shows overnight, hence the nickname Old Time Radio given by several listeners. No formal ID has ever been heard. News is typically heard at the top of the hour, and seems to be syndicated news audio provided by “Feature Story News“. I’ve noticed that today, June 6, I am not hearing any news.

The first thing that comes to mind is that this is a pirate radio station. There’s no SWBC stations assigned to these frequencies. While speculation about pirate radio station transmitter locations is often frowned upon by parts of the pirate radio community, propagation (based on who can hear the station at various times of the day) clearly shows that the transmitter site is somewhere in the northeastern USA or southeastern Canada. That is pretty obvious. And the signal levels are typical of what you’d expect from a pirate station running something on the order of 100 watts, give or take a factor or two or three. But the surprising thing is how active the station is, running nearly 24/7. Someone’s not that afraid of enforcement activity by the FCC. Or could it be something else, like a radio contractor doing some testing? It seems unlikely, but then again, we had the famous Yosemite Sam station years ago.

So, if you’ve wanted to hear a pirate radio station, but always seem to miss them, now is your chance. Just tune around 6772 when propagation favors reception in your location from a station somewhere around the northeast USA, and you may indeed hear Old Time Radio, or whoever they are.

June 7 Update:
At 2129 UTC on June 7, 2014, the station went QRT on 6771, then came back on 6976 (a new frequency for it) at 2136 UTC.

DX Toolbox 4.3.0 Released

Version 4.3.0 of DX Toolbox, the radio propagation app for Windows and Mac OS X has been released.

This version adds the Ionosonde Plot Window. This window lets you see graphs of ionosonde data from a number of sites around the world. Select the site from the first popup menu (there are dozens of sites around the world), then select the type of graph from the second. There are three types:

foF2: This is a plot of the highest frequency that will be reflected from the F2 layer of ionosphere when transmitted straight up. As the incident angle is decreased, higher frequencies will be reflected, that is, more distant stations can be heard, or alternatively, more distant locations can receive the signal. This effect explains the “skip zone” around a transmitter site.

foEs: This is a plot of the highest frequency that will be reflected from the E layer of the ionosphere.

hmF2: This is a plot of the height of the F2 layer of the ionosphere. Along with the foF2 value, it can be used to calculate the MUF for a given path.

Here is a screenshot of what the window looks like, click on it to see it full sized:

DX Toolbox also displays a variety of other information, here is the main window of current space weather:

There is also this chart of recent solar and geomagnetic conditions:

Several propagation forecasting tools are also available. This one computes the MUF (maximum usable frequency) and LUF (lowest usable frequency) between two locations, as well as the estimated received signal levels:

You can read more about DX Toolbox here, and see more screenshots here.

Copies of DX Toolbox for both Windows and Mac OS X can be downloaded from the download page.

An version (minus a few features) is also available for the iPhone and iPad.

Winter 2013-2014 Snowfall

With March ending, I’m hoping we’re done with snow. Here are my measured snowfall totals for the season:

Sunday December 8, 2013: 7 inches snow, some freezing rain
Tuesday December 10, 2013: 6.25 inches snow
Saturday December 14, 2013: 2.5 inches snow
Tuesday December 17, 2013: 0.5 inches snow
Thursday December 26, 2013: 0.75 inches snow

December 2013 total: 17.00 inches snow

Thursday January 2, 2014: 6.00 inches snow
Friday January 10, 2014: 0.25 inches snow
Saturday January 18, 2014: 1.00 inches snow
Tuesday January 21, 2014: 8.00 inches snow
Wednesday January 29, 2014: 0.50 inches snow
Friday January 31, 2014 Graupel

January 2014 total: 15.75 inches snow

Monday February 3, 2014: 7.00 inches snow
Wednesday February 5, 2014: Ice Storm : 1/4 – 1/2 inch freezing rain, 1.00 inch snow / sleet
Sunday February 9, 2014: 1.75 inches snow
Thursday February 13, 2014: 16 inches of snow in the morning, 4 inches at night, 20 inches total
Saturday February 15, 2014: 0.5 inches snow
Monday February 17, 2014: 2.0 inches snow
Tuesday February 25, 2014: 0.25 inches snow
Wednesday February 26, 2014: 0.5 inches snow

February 2014 total: 33.00 inches snow

Monday March 3, 2014: 3.0 inches snow
Monday March 17, 2014: 3.75 inches snow
Tuesday March 25, 2014: 1.50 inches snow
Wednesday March 26, 2014: Dusting of snow
Sunday March 30, 2014: 4.0 inches of snow
March 2014 total: 12.25 inches snow

2014-2013 season total: 78.00 inches snow

Looking for some iPad/iPhone apps? Here are a few that I have written: http://www.blackcatsystems.com/iphone/index.html

Pictures of some snowfall events:

January 31, 2014 Graupel:
January 31, 2014 Graupel

February 5, 2014 Ice Storm:
February 5, 2014 Ice Storm

February 13, 2014 Snow storm, pictures taken on the 14th:
February 13, 2014 snowfall

March 30, 2014 Surprise snow storm

Looking for some iPad/iPhone apps? Here are a few that I have written: http://www.blackcatsystems.com/iphone/index.html