Boom Box Radio Early Morning Propagation Analysis

Boom Box Radio had an early morning transmission on March 10, 2013, from 1044 until 1212 UTC. They were trying to reach a listener in Guatemala. The time of this transmission, starting just before to after sunrise, lets us examine the effects of sunrise on reception on the 43 meter band.

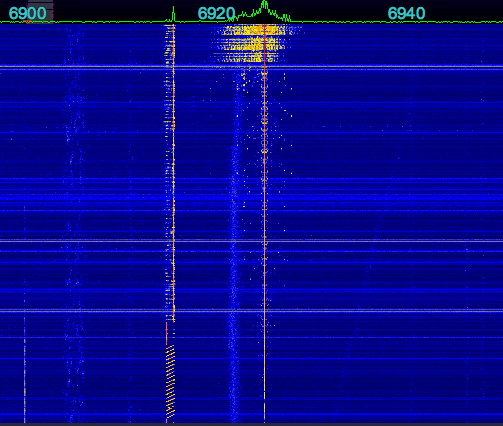
This first waterfall shows when Boom Box Radio signed on at 1044 UTC. You can see a very faint trace appear on the waterfall about a quarter of the way up from the bottom, at 6925 kHz. Remember that with a waterfall, time flows or falls down, like with a real waterfall, so the latest information is at the top:

This next waterfall shows what happened at 1107 UTC, when the signal went from just a faint trace of a carrier on the waterfall, and no audio, to a very good S7 to S9:

Note again that the oldest information as at the bottom of the waterfall. At that time, there is just barely a carrier. Then you start to see some modulation, and then finally, in a matter of seconds, the signal shoots up to armchair quality.

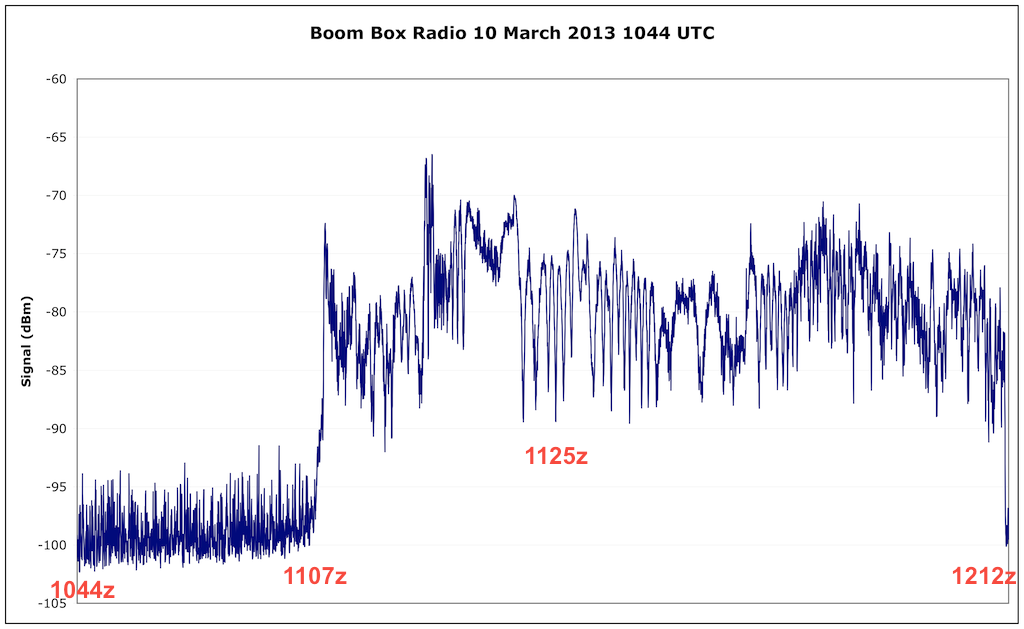
Below is a graph showing the signal strength of Boom Box Radio, in dBm, from 1044 UTC sign on, until 1212 UTC sign off. You can click on it to see a larger version:

An S9 signal corresponds to -73 dBm. Every S unit is 6 dBm, so S8 is -79 dBm, S7 is -85 dBm, etc.

I have annotated several important times: The 1044 UTC sign on, 1107 UTC when the signal went up, 1125 UTC which was local sunrise, and 1212 UTC when it went off the air.

You can see that there is a very slow increase in signal level after the sign on, but the signal remains extremely weak. Then suddenly at 1107 UTC, the signal shot up to S9. Then for the rest of the transmission it mostly stayed in a range between S7 and S9.

The sudden increase in signal was caused by the Sun increasing the ionization level of the F layer of the ionosphere. This increase needs to have occurred at the point in the ionosphere where the radio waves are being reflected, most likely roughly midway between the transmitter and receiver locations. Note that in my case, this occurred before my local sunrise. This could be due two at least two factors I can think of. First, the transmitter site could be to my east. Second, the ionosphere is several hundred miles up, so it experiences sunrise before a point directly below it (on the Earth’s surface) does.

I believe this graph shows the importance of selecting the correct time for transmissions, depending on your target area. Just before sunrise is when the ionosphere is the weakest, and is only able to reflect radio waves on 43 meters at low angles. Too early in the morning, and the band is not open for local (NVIS – Near Vertical Incidence Skywave) reception. The band is, however, open for reception to more distant locations, that is, more than many hundreds of miles away (well over 500, perhaps close to 1,000 miles). If you’re trying to get out to DX locations, this is a good time to do it. Sunrise varies throughout the year, so as we move into summer, and it occurs earlier, the band will likewise open up earlier for NVIS. Likewise in the middle of winter in December, it is somewhat later.

For reference, the operator of Boom Box Radio stated that this was a Heathkit DX-60 transmitter putting out 40 watts into a 40 meter band dipole that was about 15 feet high.

I thank Boom Box Radio for conducting this early morning test.

Update: The operator contacted me again to mention that his local sunrise was at exactly 1107 UTC.

Shortwave Pirate Radio 2012 – A Year in Review

To gauge shortwave pirate radio activity in 2012, I analyzed the loggings to the HF Underground (http://www.hfunderground.com) message board. A computer script parsed the message thread titles, as well as the timestamps of the messages. This information was used to produce some statistics about the level of pirate radio activity. Of course, as Mark Twain has written: “There are three kinds of lies: lies, damned lies, and statistics.” Still, let’s see what we can learn.

There were 8683 messages posted to 2081 unique threads. Ideally, each thread represents an individual pirate station transmission. Also ideally, each message posted to a thread represents one logging. In reality, there is some error involved.

For example: the thread with the most messages, and therefore probably the most logs, and less probably the most listeners hearing it, was Wolverine Radio on October 19, 2012, with 39 messages. The numbers are slightly inflated, since a few reporters posted more than once. But it’s still a useful gauge how well heard a transmission was. If you’re interested, second place was a logging of an UNID on 3223 kHz on March 28, 2012, third place was Wolverine Radio again, on September 30, 2012, and fourth place was Pirate Radio Boston, on October 27, 2012. The UNID station had a lot of duplicate posts by individuals, which accounts for the high ranking.

The following graph shows the number of logging threads with a given number of messages:
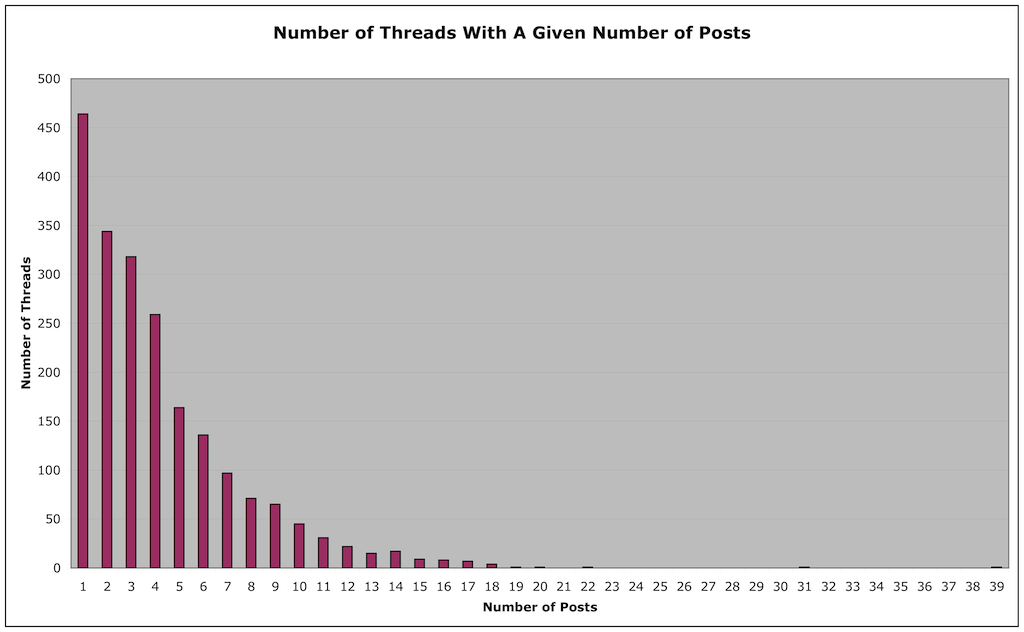
Looking at the graph, we see that there were 464 broadcasts with a single logging. 344 broadcasts had two loggings, 318 had three loggings, and so on. This tells us that the vast majority of transmissions were only reported by a small number of people. Over half were logged by three or fewer people, and three quarters by five or fewer people.

This of course does not mean that only that number of people heard the transmission. It is quite probable that the vast majority of pirate radio listeners do not log their reception reports on the HFU or any message board. Some may directly contact the station, while others listen but have little or no contact with other pirate enthusiasts or stations. Anecdotal evidence suggests there are a lot of “lurkers” in pirate radio, who may in fact be the vast majority of listeners. It is unfortunately impossible to come up with a good estimate of how large the pirate radio listening community really is.

If we assume each thread represents a unique transmission, then if we count the number of threads per pirate station, we can estimate how many transmissions they had. There are a few flaws with this method. First, it’s possible that there are some duplicate threads for a given transmission (two threads started by two listeners for the same transmission). This could inflate the estimate number of transmissions. Second, the loggings posted on the HFU represent what users heard and reported. There’s often stations that people hear but do not log, perhaps because they don’t get around to it, or because they’re not HFU users. Hang out on IRC #pirateradio for a while, and you will see many transmissions being mentioned, but never logged. This could make the estimated number of transmissions obtained by this method too low. Third, there’s also the question of what “counts” as a transmission. If a station was on for a few seconds with a test, but was logged by name, then it gets count. Finally there likely are some transmissions that no one heard, possibly due to poor propagation conditions.

Tabulating the information by station name, here are the stations with at least two or more transmissions logged on the HFU, sorted by number of transmissions (message threads):

Stations With Most Transmissions:
#1 Rave On Radio (85)
#2 Radio True North (82)
#3 Captain Morgan (81)
#4 Undercover Radio (79)
#5 Radio Ga Ga (66)
#6 Blue Ocean Radio (62)
#7 Wolverine Radio (51)
#8 Radio Ronin (49)
#9 Red Mercury Labs (42)
#10 WBNY (36)
#11 Turtlehead Radio (33)
#12 WMPR (32)
#13 XFM (23)
#14 Pirate Radio Boston (23)
#15 Renegade Radio (21)
#16 Channel Z (19)
#17 Metro Radio International (18)
#18 The Crystal Ship (18)
#19 WPOD (18)
#20 Big Boobs Radio (15)
#21 Grizzly Bear Radio (15)
#22 Voice of Captain Ron (15)
#23 Northwoods Radio (14)
#24 Toynbee Radio (14)
#25 Radio Bleh Bleh (13)
#26 MAC Shortwave (12)
#27 EAM Guy (11)
#28 Insane Radio (10)
#29 Northern Relay Service (10)
#30 Radio Free Mars Radio (10)
#31 Chamber Pot Radio (9)
#32 Liquid Radio (9)
#33 Radio 2012 International (9)
#34 Radio Free Euphoria (9)
#35 Radio Jamba International (9)
#36 Stone Circles Radio (8)
#37 WFMT (8)
#38 Eccentric Shortwave (7)
#39 All Along The Watchtower Radio (6)
#40 Appalachia Radio (6)
#41 Hot Legs Radio (6)
#42 KPZL (6)
#43 Mushroom Radio (6)
#44 PeePee Vagina (6)
#45 Radio Casablanca (6)
#46 Radio Strange Outpost 7 (6)
#47 WBOG (6)
#48 XLR8 (6)
#49 Pissant Radio (5)
#50 Radio Whatever (5)
#51 The Machine (5)
#52 WEMP (5)
#53 Ann Hoffer Live (4)
#54 CYOT (4)
#55 Radio Vixen International (4)
#56 KAOS (3)
#57 EAM Girl (3)
#58 Hard Tack Radio (3)
#59 KIPM (3)
#60 KMUD (3)
#61 WPON (3)
#62 Cool AM (2)
#63 Dit Dah Radio (2)
#64 Pandora’s Box (2)
#65 Radio Clandestine (2)
#66 Radio KEN (2)
#67 WHYP (2)

Not making this list are stations with only one transmission reported. Also, since the loggings were analyzed with a script, it is possible that
some logs were missed due to misspelling of the station name, etc.

And in reality, in #0 position way at the top, would be:
#0 UNID (534)

As you can see, there are a lot of UNID stations reported. Many of these are short test transmissions, or one or two songs played. Some are longer, full length transmissions, with either no attempt at an ID by the operator, or conditions were such that no listener was able to pull out an ID.

It’s worth pointing out, again, that these lists are based on the logs posted on the HFU. There are many reasons why a particular station’s broadcasts occurred but were not reported. The user base of the HFU is heavily centered around the Northeast and Midwest of the US. There could be transmissions from other parts of the country, particularly the West Coast, which are not being reported, because there are too few users from that region. There are also certain stations which some listeners have decided not to publicly log, for a variety of reasons.

Next, we can count the total number of loggings for each station, and see how they rank. Note that this is sensitive to duplicate posts by the same listener for a given transmission, so values for some stations can be inflated:

Stations With Most Loggings:
#1 Undercover Radio (429)
#2 Wolverine Radio (413)
#3 Captain Morgan (382)
#4 Radio True North (357)
#5 Rave On Radio (346)
#6 Radio Ronin (341)
#7 Blue Ocean Radio (288)
#8 Radio Ga Ga (229)
#9 WMPR (195)
#10 Red Mercury Labs (189)
#11 XFM (168)
#12 Turtlehead Radio (129)
#13 Renegade Radio (116)
#14 Channel Z (114)
#15 WBNY (108)
#16 Metro Radio International (96)
#17 Pirate Radio Boston (88)
#18 WPOD (74)
#19 The Crystal Ship (70)
#20 Big Boobs Radio (69)
#21 Grizzly Bear Radio (69)
#22 Radio 2012 International (62)
#23 Northwoods Radio (55)
#24 MAC Shortwave (54)
#25 Voice of Captain Ron (54)
#26 Toynbee Radio (53)
#27 EAM Guy (50)
#28 Radio Bleh Bleh (46)
#29 Liquid Radio (45)
#30 Radio Jamba International (45)
#31 Radio Free Mars Radio (45)
#32 WFMT (38)
#33 Hot Legs Radio (38)
#34 Radio Vixen International (38)
#35 Northern Relay Service (37)
#36 KAOS (34)
#37 Ann Hoffer Live (34)
#38 Radio Strange Outpost 7 (34)
#37 Mushroom Radio (33)
#40 Eccentric Shortwave (31)
#41 All Along The Watchtower Radio (31)
#42 Radio Casablanca (31)
#43 Insane Radio (29)
#44 XLR8 (28)
#45 KPZL (27)
#46 Appalachia Radio (27)
#47 Radio Whatever (27)
#48 KIPM (26)
#49 Radio Free Euphoria (26)
#50 WBOG (22)
#51 The Machine (22)
#52 Chamber Pot Radio (21)
#53 Pissant Radio (21)
#54 Hard Tack Radio (20)
#55 PeePee Vagina (20)
#56 Stone Circles Radio (19)
#57 Dit Dah Radio (15)
#56 Pandora’s Box (11)
#57 WEMP (10)
#58 WPON (10)
#59 KMUD (8)
#60 CYOT (7)
#61 WHYP (7)
#62 Radio KEN (7)
#63 EAM Girl (6)
#64 Cool AM (4)
#65 Radio Clandestine (4)

In general, the stations that transmitted the most, were reported the most. The largest exception to this rule is Wolverine Radio, which is #7 for total broadcasts, but #2 for total reception reports. Wolverine is often noted with a very strong signal, this may count for some of the larger ratio of reception reports to transmissions.

In fact, we can produce a table of the ratio of reports to transmissions for stations (with more than 10 transmissions, to reduce errors due to insufficient data). Stations with a high ratio have a lot of listeners per transmission, stations with a low ratio have few listeners per transmission:

8.10 Wolverine Radio
7.30 XFM
6.96 Radio Ronin
6.09 WMPR
6.00 Channel Z
5.52 Renegade Radio
5.43 Undercover Radio
5.33 Metro Radio International
4.72 Captain Morgan
4.65 Blue Ocean Radio
4.60 Big Boobs Radio
4.60 Grizzly Bear Radio
4.55 EAM Guy
4.50 Red Mercury Labs
4.50 MAC Shortwave
4.35 Radio True North
4.11 WPOD
4.07 Rave On Radio
3.93 Northwoods Radio
3.91 Turtlehead Radio
3.89 The Crystal Ship
3.83 Pirate Radio Boston
3.79 Toynbee Radio
3.60 Voice of Captain Ron
3.54 Radio Bleh Bleh
3.47 Radio Ga Ga
3.00 WBNY

The average ratio is 4.75.

If we look at the estimated number of broadcasts by day of week, the results are inline with what we expect, namely that the weekends are most active, with a lull during the middle of the week:

Sunday 485
Monday 205
Tuesday 174
Wednesday 173
Thursday 173
Friday 320
Saturday 551
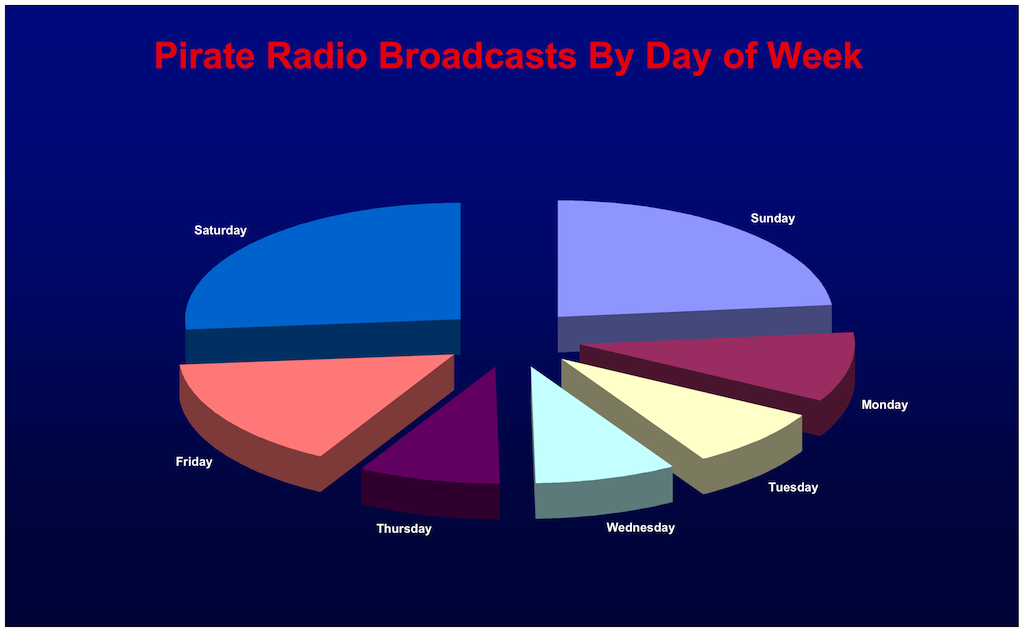
However, even the days in the middle of the week (Tuesday, Wednesday, and Thursday) have some level of pirate activity, about 3 or 4 transmissions per day. This is a very high level of activity as compared to what I remember from the 1980s and even the 1990s. Back then, weekday transmissions were much less common.

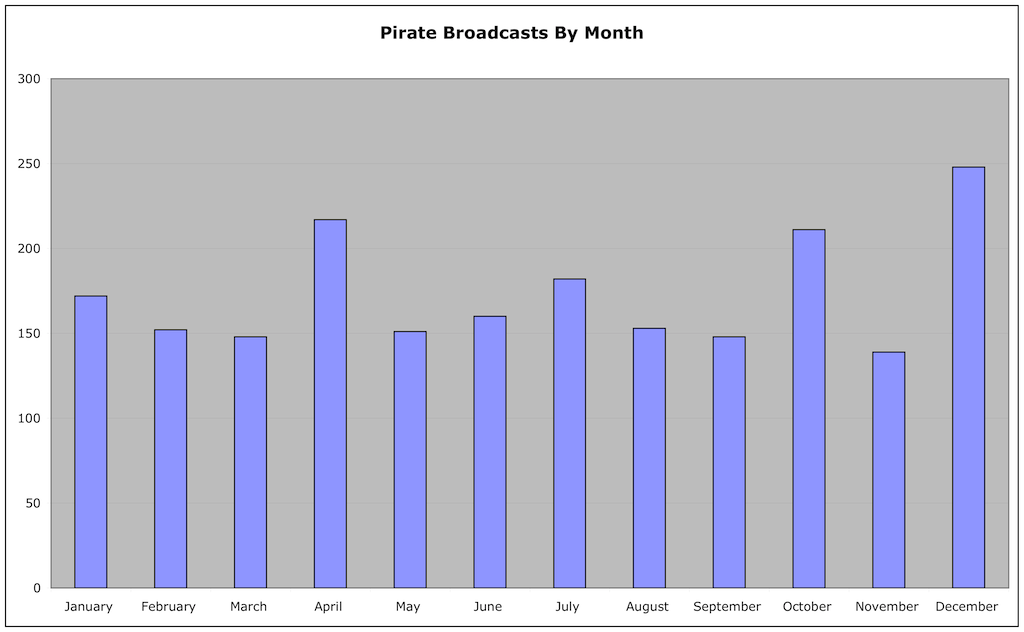
Breaking down the activity by month, we see there is some variation, with the busiest month, December (as we’d expect, with all the holidays) a little less than twice as active as the slow months in the Spring:

January 172
February 152
March 148
April 217
May 151
June 160
July 182
August 153
September 148
October 211
November 139
December 248
Looking at the transmitting modes used, AM and USB are virtually tied, with USB having a slight edge. The other modes are literally noise, with a small handful of reports. There’s a significant number of logs where no mode was reported, but it is virtually certain that either AM or USB was used:

AM 822
USB 849
LSB 21
CW 29
FM 21
SSTV 65
UNKNOWN 274

And what about the choice of transmission frequency? 6925 is the big winner, accounting for over half, and close to two thirds, of the logged broadcasts. If you add in the logs for 6924 kHz, which no doubt are pirates trying to end up on 6925 but who have a crystal or VFO that is slightly off, you end up with an even larger total. Clearly, if you can only monitor one pirate frequency, 6925 is the one:

6240 kHz: 4
6850 kHz: 5
6899 kHz: 9
6900 kHz: 12
6920 kHz: 5
6924 kHz: 82
6925 kHz: 1343
6926 kHz: 7
6927 kHz: 6
6929 kHz: 5
6930 kHz: 132
6932 kHz: 4
6933 kHz: 8
6935 kHz: 75
6940 kHz: 47
6945 kHz: 24
6949 kHz: 6
6950 kHz: 104
6951 kHz: 11
6955 kHz: 39
11428 kHz: 5
15070 kHz: 16

There are still a significant number of transmissions on other frequencies, with 6930 and 6950 being the most popular. 6955, which at one time was the most used pirate frequency in North America, is now down to 6th place, lower than the number of broadcasts by ops on 6925 kHz with a off frequency crystal.

Your comments, questions, and suggestions are greatly appreciated!
A Very Busy Christmas Weekend/Eve For Pirates

Here’s what folks have been hearing since Friday night. 41 different North American pirate radio transmissions so far, a total of 163 loggings, and it’s not even Christmas yet!

A big thank you to the operators for their shows, and the listeners for their reports.

All of these loggings can be viewed at the HF Underground

Pirate Radio Boston 6925 AM 1945 UTC December 24, 2012
WBNY 6240 AM 1604 UTC December 24, 2012
Eccentric Shortwave 6930 USB 1529 UTC December 24, 2012
Channel Z 6925 AM 1400 UTC December 24, 2012
UNID 6925 USB 1455 UTC December 24, 2012
Metro Radio International 6975 AM 1323 UTC December 24, 2012
Radio Ronin 6920 AM 1308 UTC December 24, 2012
Northwoods Radio 6925 USB 1200 UTC December 24, 2012
Channel Z 6925 AM 0427 UTC December 24, 2012
UNID 6955 AM 0212 UTC December 24, 2012
Rave On Radio 6925 USB 0200 UTC December 24, 2012
Radio GaGa 6925 USB 0140 UTC December 24, 2012
Radio Appalachia 6935 AM 0125 UTC December 24, 2012
Dit Dah Radio 6925 USB 0025 UTC December 24, 2012
Dit Dah Radio 6935 USB 2156 UTC December 23, 2012
WBNY 6913.34 AM 2150 UTC December 23, 2012
WKND 6924.6 AM 2148 UTC December 23, 2012
Metro Radio International 6925 AM 2008 UTC December 23, 2012
WEDG The Edge 1610 AM 1700 UTC December 23, 2012
Pirate Radio Boston 6925 AM 1612 UCT December 23, 2012
Pirate Radio Boston 6950 AM 1610 UTC December 23, 2012
Pirate Radio Boston 6925 AM 1805 UTC December 23, 2012
Channel Z 6925 AM 1346 UTC 23 December 23, 2012
1720 KHz “The Big Q” 0509 UTC December 23, 2012
Channel Z 6925 AM 0405 UTC December 23, 2012
WPOD 6925 USB 0130 UTC December 23, 2012
Wolverine Radio 6925 USB 0048 UTC December 23, 2012
Toynbee Radio 6925 AM 2258 UTC December 22, 2012
Monkey Mayan Memorial Radio 6925 AM 2222 UTCDecember 22, 2012
UNID 6950 USB 2218 UTC December 22, 2012
UNID 6924.7 Khz AM 2215 UTC December 22, 2012
Toynbee Radio 6925 AM 2131 UTC December 22, 2012
Pirate Radio Boston 6949.39 AM 2015 UTC December 22, 2012
UNID 6935 AM 1902 UTC December 22, 2012
Pirate Radio Boston 6949.39 AM 1355 UTC 2December 22, 2012
Rave On Radio 6925 USB 1241 UTC December 22, 2012
The Big Q 1720 & 1710 AM 0525 UTC December 22, 2012, 2208 UTC
Captain Morgan Shortwave 6950.7 AM 0240 UTC December 22, 2012
UNID 6925 AM 0225 UTC December 21, 2012
UNID 6924 AM 0203 also 6929 AM 0207 December 22, 2012
Insane Radio 6925 AM 0121 UTC December 22, 2012
Insane Radio SSTV 6925 AM 0021 UTC December 22, 2012

Propagation Gives Away Your Location

Being as pirate radio is, well, illegal, operators like to stay anonymous. At least ops who want to avoid the FCC. Naturally, most ops consider keeping their location secret very important. Some even go so far as subtly, or not so subtly, providing false clues about their location, in an effort to fool the radio authorities. Unfortunately, basic rules of radio propagation make this futile.

A warning in advance. I’m going to be discussing some basic shortwave radio propagation theory. Nothing here is brand new, or unknown to anyone in the radio field. Certainly not the radio authorities. Some fur… err… feathers are possibly going to be ruffled by what is presented below, possibly with loud protests of “destroying pirate radio” and “releasing the identities of operators”. Nothing could be further from the truth. This is Propagation 101 stuff. If it scares you, then you probably shouldn’t be operating a pirate radio station. The purpose is the educate listeners and operators, so they know exactly what information can be gleaned from observing signal reports. It’s better to know exactly what can be done with this information, than to stick your head in the sand and pretend it doesn’t exist.

As has been discussed on this blog many times before, daytime propagation on the 43 meter band (where 6925 kHz is located) is considered NVIS (Near Vertical Incident Sky Wave). The radio waves go up, and are reflected back to the Earth for a fairly short distance around the transmitter site, usually a few hundred miles at the most. Attenuation by the D layer limits distant reception. At night, it’s almost the opposite reception pattern, as the D layer fades away, allowing distant reception. And the weaker F layer limits or eliminates NVIS reception, resulting in a skip zone around the transmitter, where the signal cannot be heard. The resulting reception area is shaped roughly like a doughnut.

So, for a daytime transmission, if one looks at a set of reception reports (as well as “no reception” reports, which can be equally useful), it becomes very easy to guesstimate about where a transmitter is. Not exactly of course, or even to a particular state, but certainly within a hundred miles or two. There will be a cluster of strong reception reports around the transmitter site, out to a few hundred miles. The maximum reception distance will vary a lot with transmitter level, antennas, and propagation conditions, but is likely under 1,000 miles. Look at where all the reports are coming from, especially the strong ones, find the center, and you have a good guess as to where the transmitter is.

At nighttime, listeners too close to the transmitter site (in the skip zone) will hear nothing, or at best a very weak signal. And during the transition from NVIS to DX propagation (see Going Long and An Interesting Example of a Station Going Long) the received signal will start to peak, and then suddenly cut out. Observing when this happens at a variety of listener sites provides other clues as to the transmitter location. If the F layer height and ionization values are known (and they are available in real time online) the distant to the station can be roughly determined when the station goes long. Do this for several receiver locations, and you can guess about where the transmitter is.

One ruse some operators have used in the past is to give misleading reception reports with a low signal level, using their real name and location, as just a regular listener. This is extremely dangerous, as if anyone is paying attention, their very weak signal report can stand out like a sore thumb if there are reports from others in the same area, with much stronger signal levels. Likewise, if you’re an operator, providing a completely bogus QTH doesn’t fool the FCC one bit. Announcing a QTH out on the Great Plains, while you’re really on the East Coast, doesn’t fool anyone when you’re being heard on the East Coast with an S9 signal at local noon. It just reminds everyone that you failed PROPAGATION 101. While shortwave propagation can be odd at times, there are limits. The laws of physics still must be obeyed.

The FCC and other radio enforcement agencies of course don’t have to rely on crude techniques such as these to locate transmitters. They have modern DFing equipment that can quickly and accurately locate a pirate station. The only reason they haven’t busted a given pirate is because, (as much as this may hurt to hear) that pirate is not important enough to get a visit. For now.

The commercially available WJ-9012 HF Direction Finding System, for example, boasts an error of less than 2 degrees. At a distance of 200 miles, that’s about 7 miles. Presumably the FCC has much better equipment.

While not announcing your location is probably a good idea (if for no other reason than to come across as taunting the FCC), in reality it doesn’t do too much to protect you from the radio authorities. Not interfering with allocated radio services, especially government and military, as well as operating from random remote locations, will go a long way to avoid getting The Knock.

Keep Safe!

Anonymity For Pirate Operators and Listeners

Today, the internet is used for virtually all forms of communications between pirate listeners and operators. Loggings are posted to message boards and mailing lists. Reception reports are sent to email addresses, with eQSLs coming back to the listener by email. And listeners (and some times operators) engage in real time chats via IRC and chat rooms.

The advantages over the older forms of communications in the dark ages (pre-internet) are numerous. The most important is undoubtedly the almost instant speed with which information can be received. Once the first listener logs a station (on a message board such as the HFU / HFUnderground or via IRC), other listeners can immediately learn of this transmission, and tune in, while the station is still on the iar. Back in the old days, the logging would be sent to a SW/DX club newsletter editor (I was one for the ACE back in the 90s) where it would sit until other loggings arrived. Then the loggings column would be edited and finally the newsletter published and mailed to club members. By the time others read the logging, it was weeks if not months old.

Likewise, operators can browse the message boards or chat rooms, and learn in real time how their signal is being heard. They can also find out if there is interference, and they need to move to another frequency, or go off the air. There have been many cases of a pirate operator learning that another operator was also on the air, and they could quickly change frequencies to avoid continued interference. Or wait and not go on the air until the first station was done with their broadcast.

Reception reports and QSL verifications are almost exclusively conducted via email today. The listener sends their report to the station’s email address, and gets an eQSL back by reply. Verifications are often received in a day or two, sometimes in a matter of hours or even minutes. In addition to the instant gratification factor, there’s a huge cost savings. No need for the often cash strapped operator to print up paper QSL cards, and for listeners to spent money on postage. And the pirate operator and listener don’t have to run the risk that the maildrop they use might share personal information with others, as has been rumored to have happened in the past.

eQSLs are not “fake” QSLs. They are verifications that you heard a transmission, and are just as real as a dead tree QSL. Anyone who claims otherwise most likely has impure motives for trying to convince you to send them your personal information.

Operators and listeners do need to be concerned about possible lack of privacy issues with internet based communications. These risks, and their solutions, include:

Email Anonymity

Many email systems include the originating IP address of the sender in the message headers. In other words, your IP address. With this IP address, your location can be determined, often to your city. Of the supposedly anonymous email services, yahoo and hotmail are known to include your IP address, making them not very anonymous. Gmail, on the other hand, does not include your IP address, making it the preferred email service. Most new operators are using gmail, but many older stations continue to use yahoo or hotmail accounts. This is extremely dangerous, and operators should consider switching to gmail. Likewise, listeners who wish to maintain an anonymous identify should also consider using gmail, if they aren’t already.

Message boards / Chat Rooms / Web Sites

Many pirate radio resources exist on the web. These include message boards, real time chat rooms, as well as general purpose websites. These sites all use web servers and clients, and share the same privacy risks.

When you connect to a web server, it records your IP address and what pages you viewed, as part of the server logs. The administrator of the website often uses this information to determine how popular various pages are on the site, as well as what parts of the world visitors are from. More sophisticated analytical tools can even “follow” a user as he navigates the website, to observe in what order he traverses the various pages. Generally this information is not used for nefarious purposes, but rather to help the website administrator improve the quality of the site, and increase the number of visitors.

Your IP address can be used in the same way as with email headers, to roughly determine your location. Of course, this is only relevant if the person examining the logs knows who you are. If you are just a visitor to the site, not logged in, then your IP address appears alongside the hundreds or thousands of other visitors, and there is no information that links it back to your identity. You’re just 192.168.0.1, or whatever your IP address happens to be.

If you’re logged into the site, then your IP address is of course linked to your user name. If you log in as a pirate operator with your station or DJ name, then the weblogs can be used to roughly determine your geographic location from the IP address. The solution is to use an anonymous web proxy. This is essentially another web server that you connect to first. Then you tell it the URL of the site you want to visit. All data between you and the final website is passed between the proxy, which hides your IP address. You just have to trust the web proxy that you use!

IRC (Internet Relay Chat)

Users connect to IRC servers with client software. Your IP address is available to IRC operators (usually not an issue since most of them have no idea what pirate radio even is) and sometimes to other users (which can be an issue). Many IRC servers mask the IP address, usually by changing the last octet. While this does hide your exact IP address, the remaining three octets are usually sufficient to roughly determine your location, as with email and the web. One solution is to use a pseudonym as your IRC nickname, not related to your actual name or station/DJ name. That way, you just appear as another pirate radio enthusiast, and no one knows who you really are. Another is to use a web based IRC client, and connect to it via a web proxy. Problem solved.

Safer web browsing

If you’d rather avoid being tracked on unfamiliar or “hostile” sites, try the Startpage search engine, which features the option of using Ixquick proxy to mask your location and machine type.  Many free web proxies will mask your location (IP), but few will mask your machine type.  Are you that one guy using Windows Vista on a PC with monitor resolution set to 800×600?  If so, you’re easy to spot. Ixquick proxy randomly rotates among a dozen or so types, making it more difficult for snoopy web/blog owners to identify visitors.

Note that some proxies will disable certain functions including Javascript.  It will also hinder the site’s web traffic logs and ad revenue.  If you trust and support a site, consider unproxying and giving the site owner the benefit of your visit.  It’s your choice, so be informed and choose wisely.  And if you get serious about web browsing security, check into the Tor project and other proxy options.

Personal Information in Documents and Images

If you create and send documents and images (such as PDF files or JPEG pictures) be aware that some applications include personal information in the document’s metadata. This could include the name of the registered user for the program.  There are various tools out there that can open documents and display any metadata that is present. If you’re concerned, get some of these programs and make sure that files you create and send don’t compromise your identity.  The free/shareware image editor Irfanview can be used to view metadata and, if desired, re-save images such as eQSLs with metadata stripped for security.

Enjoy Pirate Radio

Don’t let these issues dissuade you from using the internet as part of your pirate radio hobby. If you follow a few simple steps, you can feel secure about your privacy. And don’t let the Chatrooms and the Internet are Eeeeevil crowd scare you, they have ulterior motives for encouraging you to use their snailmail maildrops and other ancient forms of communications – namely to collect more details about you.

Vladimir Putin Destroys Pirate Radio

   PSK31     
   iPad app to decode PSK31     

For the last few weeks, there’s been a new source of QRM on the most popular shortwave pirate radio frequency in North America, 6925 kHz. Last night, it was particularly bad. Here’s a recording of what it sounds like, when tuned to 6923 khz USB.

Putin on the QRM

The offending signal is a Russian Military 12 Tone PSK AT-3004D modem, often referred to as the “Russian 12 Tone Modem” in utility DXer circles, and also the MS5.

There is a very good writeup about it at this site: http://www.signals.taunus.de/FFT/CIS12CH.HTML

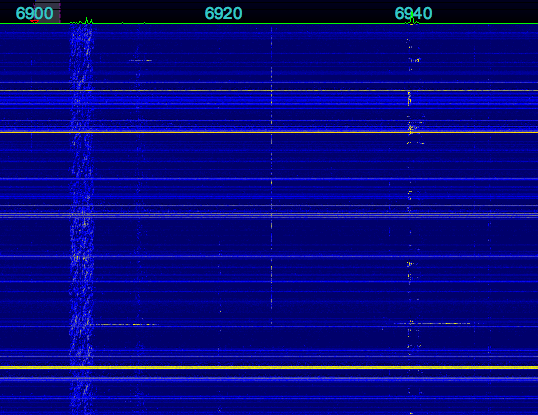
Here is an SDR waterfall image of the modem:

You can see the stronger pilot carrier on the extreme right (highest frequency) as well as the 12 PSK channels.

The signal faded in at around 2300 UTC, was quite strong around 0030 to 0200 UTC, and faded out around 0400 UTC. The local fade in time is due to the Sun starting to set here, and the path being mostly dark, to support propagation on this frequency. The fade out time is due to sunrise at the transmitter site. This suggests a location somewhere in Europe.

If this modem continues to transmit around 6925 kHz, operators may wish to work around it, by avoiding 6925 kHz during the time the 2300-0400 UTC time the signal is present. Unfortunately this is also the most popular time for pirate transmissions. Due to the strong signal strength, and the wideband nature of the signal, it can to obliterate any weaker stations on the frequency.

Daytime Vs Nighttime Static Levels And The Impact On Reception

Undercover Radio was on 6925 kHz USB several times on Sunday, May 20, 2012, conducting some transmitter tests in the afternoon, and with a show in the evening. I noticed how, even with a relatively weak signal strength in the afternoon, the overall reception was still good, due to the low daytime noise levels on the 43 meter band. Transmitter power was around 20-30 watts PEP.

Here is a graph showing the signal level of Undercover Radio on 6925 kHz, as well as background noise from an otherwise unoccupied adjacent frequency for 4 minutes, starting at 1700 UTC May 20, 2012:

Undercover Radio’s signal strength was about -92 dBm. Bear in mind that this was a voice only program with Dr. Benway talking, with frequent pauses in speech. Since this was an SSB transmission, the received signal level falls to the background noise level during pauses in speech.

The background static at 6930 kHz was -100 dBm

The net result is a signal to noise ratio of 8 dB, which is certainly adequate for fair to good reception.

Some recordings:
Undercover Radio 6925 kHz USB 1700 UTC
Background noise 6930 kHz USB 1700 UTC

Undercover Radio came back on at around 1900 UTC. Here is another comparison of Undercover’s signal vs background noise on 6932 kHz:

(Sorry, this time the noise is pink and the signal is blue. Just to keep you on your toes)

Eyeballing the graphs, it looks like the signal to noise ratio was about 15 dB, better than before. The quality of the received audio was indeed very good. Here is a recording

Next, Undercover Radio came on again at 0212 UTC.

The noise levels were around -85 dBm. Undercover Radio’s signal started at just around the noise level. At the time, he was running 20-30 watts PEP. Later, around 0245, Dr Benway realized he didn’t have the amp on, and then switched it on, going to 500-600 watts PEP.

One reason for the much higher nighttime noise levels is that not only is 43 meters open to DX from distant stations, but also to distant thunderstorms and other noise sources. Think of every thunderstorm in the world as a transmitter (which it really is). There’s thousands of active thunderstorms at any time, transmitting RF energy over the entire radio spectrum. This energy is received at your location from whatever parts of the world propagation is open to, on a given frequency. So while your signal can get out further at nighttime, it also has to compete with a lot more QRM sources.

During the daytime, the D layer of the ionosphere attenuates low angle radiation on 43 meters, preventing DX reception. You’re limited to just a few hundred miles. This applies both to the signals from radio stations that we want to hear, and distant noise sources.

Also notice how much Undercover Radio’s signal varied after the amp was switched on – by around 30 dB. That’s five S units! This tells us that signal reports, or even recordings, can be very hit or miss. One minute, an op can be at the noise level, a few minutes later, he can be many S units above it.

Two recordings. First, one from 0222 UTC when he was running 20-30 watts PEP, and the SNR was just a few dB. And second, one from 0300 UTC during a signal peak, when he was running 500-600 watts PEP, and the SNR was about 25 dB.

For comparison, here are some plots of WWCR, 6875 kHz, showing their signal level last night:

First, from 2230 to 0100 UTC (sorry for the X axis scaling, showing -100 for 2300 UTC. Blame Excel)

You can see that when their carrier went off the air, the noise level was around -80 dBm. And the signal varies by about 30 dB during the transmission, during nighttime. Earlier in the transmission, while it was still daytime, the signal was slightly weaker, but there was a lot less fading.

And second at 0300 UTC:

Perhaps the main point to take away from this is that while a pirate can be heard much further at nighttime than during the daytime on 43 meters, the lower noise levels and lack of significant fading during the daytime generally make for better quality reception, for those listeners within the several hundred mile NVIS range, and allows reception by listeners with more modest receiver/antenna setups. This is especially true when using lower power (grenade type) transmitters. Nighttime DX reception quality will be poorer, and limited to those with more substantial receiving stations. By selecting the time of day for operation, operators can to some degree select their audience and target area. A pair of transmissions, one in the daytime and one at night, would reach both local and DX listeners.

Signal Levels of Radio True North’s May 14th Transmission on 6950 kHz

The graph below shows the received signal levels of Radio True North, a pirate radio station from Canada, which transmitted on 6950 kHz on Mary 14, 2012. The signal faded in at around 0200 UTC, and the transmitter was switched off at 0702 UTC – that can plainly be seen on the chart:

You can also see that after the transmitter switched off, the received signal levels were about -85 dBm, that is the background noise level. At peak, the signal was about -75 dBm, just a hair under S9. The signal to noise ratio is the difference between the signal and noise levels, or 10 dB.

Here is a short recording taken at around 0516 UTC, so you can hear what this signal sounds like. Remember, it is around S9, but the signal to noise ratio, which is what really matters, is only 10 dB. We had rain/thunder storms all along the east coast during this time.

Signal to noise ratios were discussed an earlier post, coincidently enough called Signal To Noise Ratios. There’s some simulated SNR recordings there. The 10 dB example sounds very close to the RTN recording above.

RTN was using his “usual power” (we’ll be vague and say a few hundred watts). Had he been using a lower power level, say 10 watts, the signal to noise ratio would have been about 0 dB, if not negative. He’s using a delta loop antenna, and is about 4,000 km (2,500 miles) away from my location.

Here’s a graph of RTN’s carrier frequency, as measured here:

You can observe both the power on drift, and short term cycling (about every 10 minutes) due to most likely to something thermal, perhaps a fan.

Lies, Damned Lies, and Receiver Images

I have my SDR-14 receiver online, for some listeners to use. The other day, there was a logging of Trenton military aviation weather on 6950 kHz. I had not seen other reports of Trenton aviation weather on this frequency. And, since 6950 is a very popular frequency for pirate radio in the USA, this could cause some concern, as QRMing military stations is generally bad karma for pirates.

Here is a recording of Trenton Aviation as received on the SDR-14.

As it turns out, I had been running a recording of 6800-7000 kHz via another SDR, my netSDR. So I went back, and checked that recording at the same time the SDR-14 had picked up Trenton on 6950. Nothing. Nothing at all. And the netSDR is connected to a much better antenna than the SDR-14. Hmm. This is strange.

Last night, I was alerted that Trenton was again being heard on the SDR-14 on 6950 kHz. So I went and tuned in on the netSDR, and again heard nothing. I then decided to look for a schedule of frequencies used by Trenton, and found that they should be on 6754 kHz. I tuned in, and sure enough, there they were. Coming in very well, about S9+30 dB or so. Hmm… I did a quick calculation, and the difference between 6950 kHz and 6754 kHz is 196 kHz. 196 kHz, that sounds familiar. Why yes, that’s the I/Q sample rate of the SDR-14!

Now it all makes sense – the received signal on 6950 kHz is an image, a false signal generated by the receiver. It turns out that even SDRs are not immune to images. (Shhh… don’t anyone tell Al Fansome)

Images have been the bane of DXers for decades. They often manifest themselves as a particularly strong signal that is picked up on other frequencies. With an analog receiver, these frequencies are often offset from the actual frequency by the IF frequency of the receiver. With VHF/UHF radios and scanners, this is often 10.7 MHz, or close to that. In the case of the SDR-14, the image was located at an offset equal to the I/Q data rate. It was probably being heard on 6558 kHz (6754 kHz – 196 kHz) as well.

If you’re hearing an unexpected signal, one suggestion is to try another radio, ideally one with a different IF frequency. If you don’t hear the signal on the second radio, then it is most likely an image. Or your other radio is broken. But it’s probably an image. Ask another DXer if they can hear it, as well.

There’s a ham in Erie, PA that has been harassing the local club that runs a 2 meter repeater with claims of interference to the VHF marine band. The FCC has investigated, and found no interference. Multiple hams have contacted the Coast Guard and they have not had any interference issues. The only person who reports interference is the previously mentioned ham, who lives a few hundred yards from the building housing the repeater. I’ll close by noting that the VHF marine band is about 10.7 MHz above the 2 meter band frequency used by the repeater – 146.610 MHz.

Wolverine Radio SSTV

Shortwave pirate radio station Wolverine Radio was on the air last night, with their typical excellent signal, excellent audio, and excellent programming. As is often the case, they finished their show with a Slow Scan TV (SSTV) image. SSTV is a way of sending an image using audio tones.

Here’s a video of the image, while it was being received. As you can see, it takes about 2 minutes to send a single image. Hence the name Slow Scan TV.

Here’s a larger video image, if you don’t mind rotating your head to watch it:

The image was decoded using the SSTV App for the iPhone, iPad, and iPod Touch which I will now shamelessly mention is

Here’s what the transmitted image looked like, by the way: