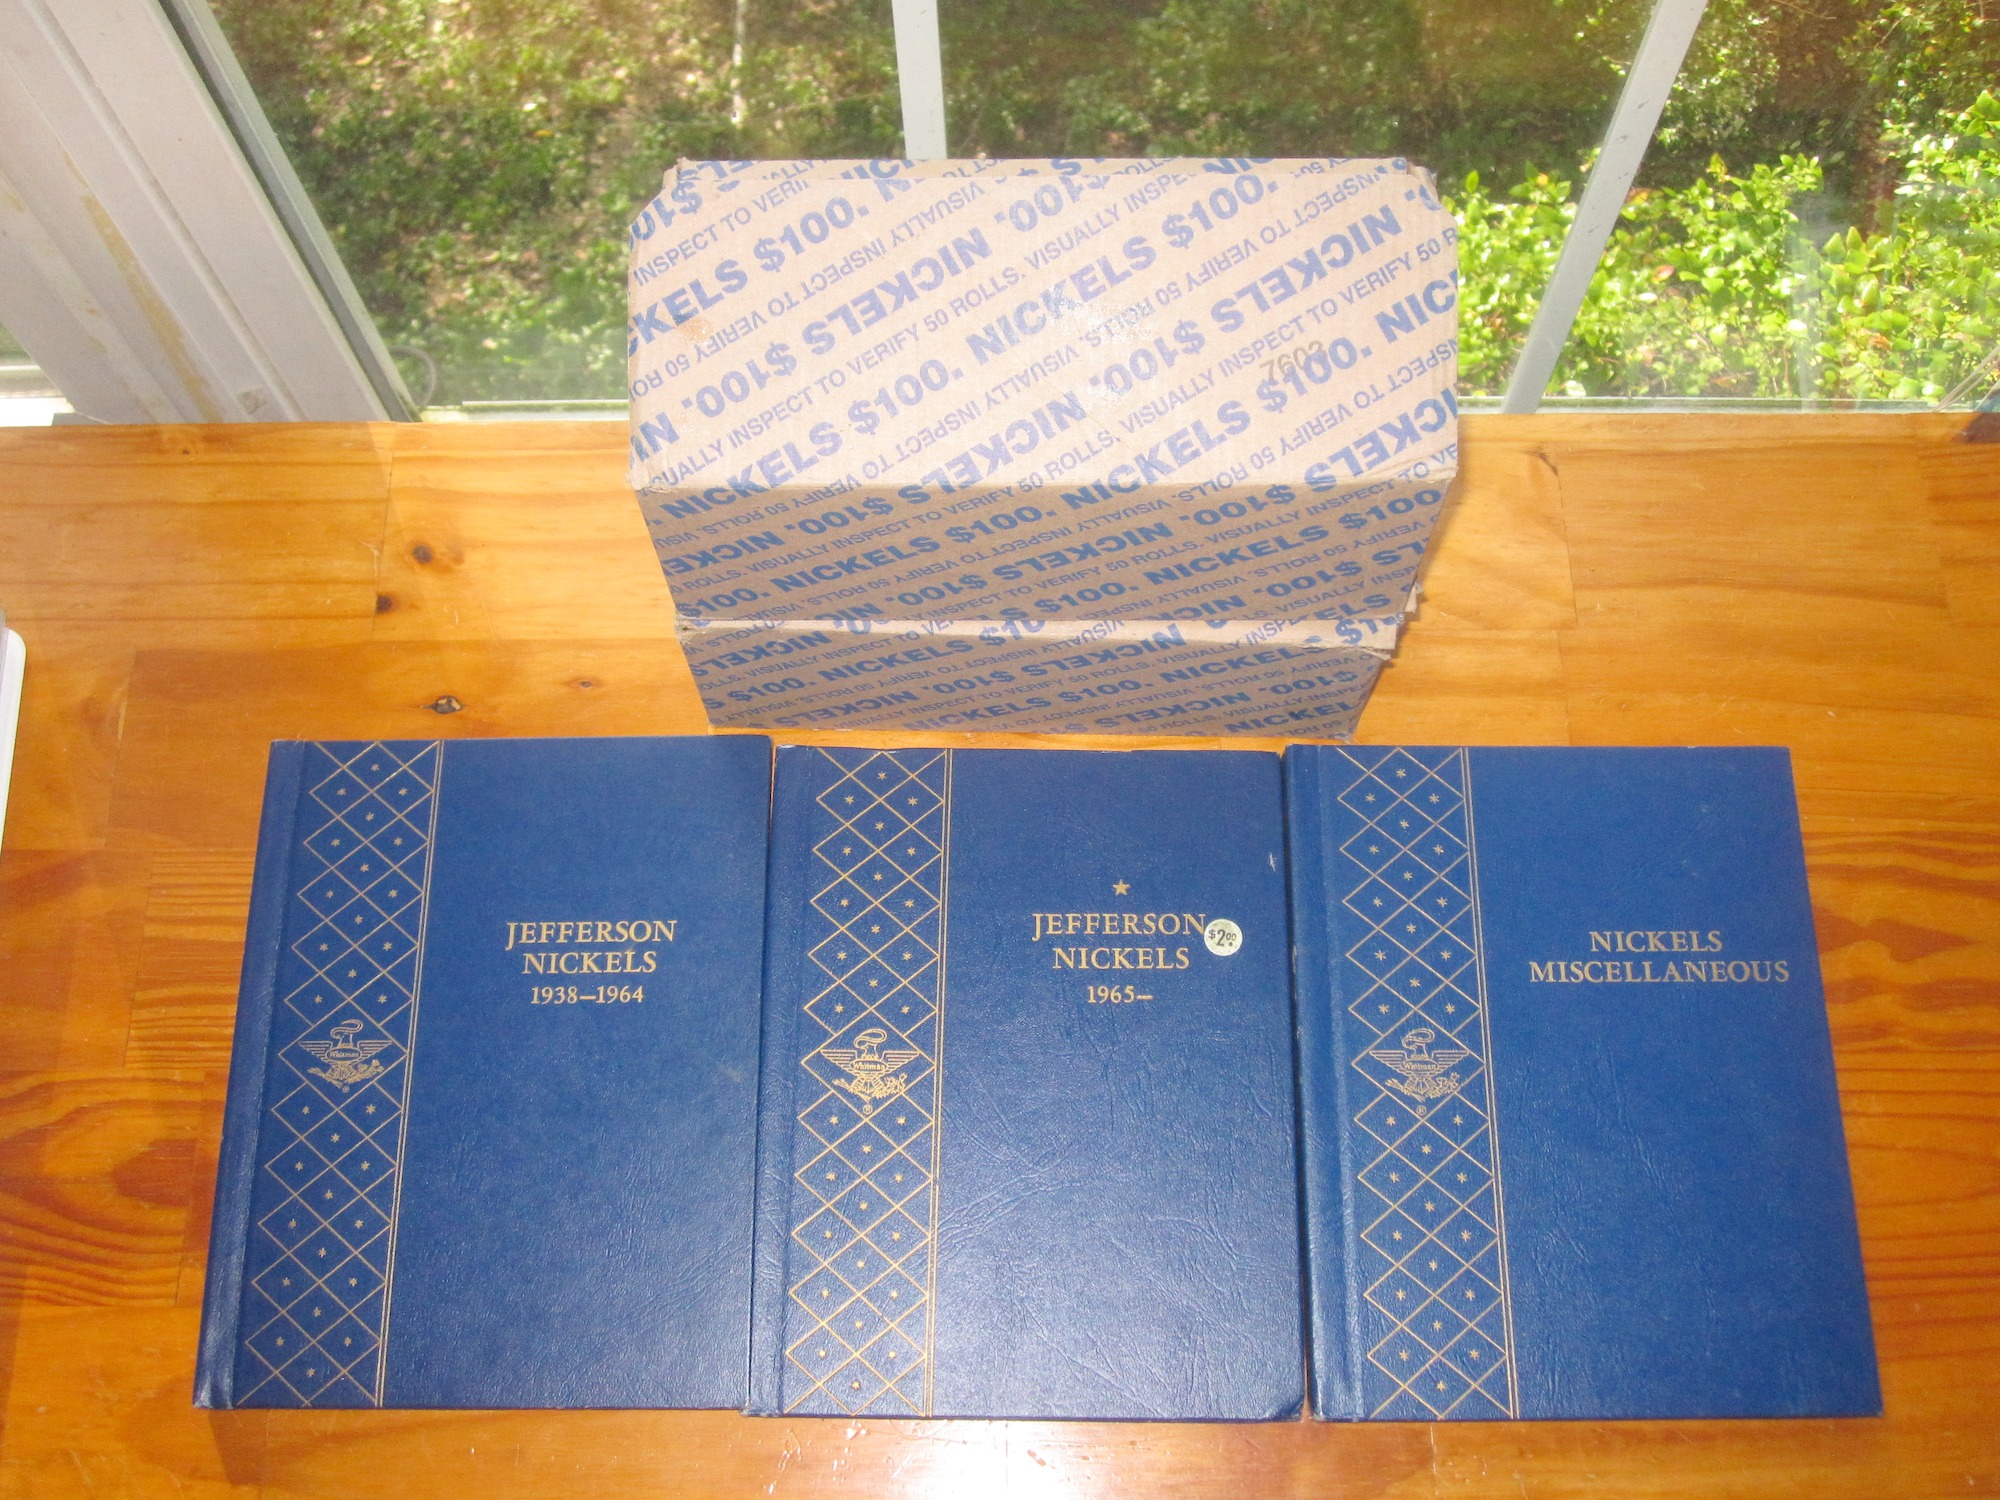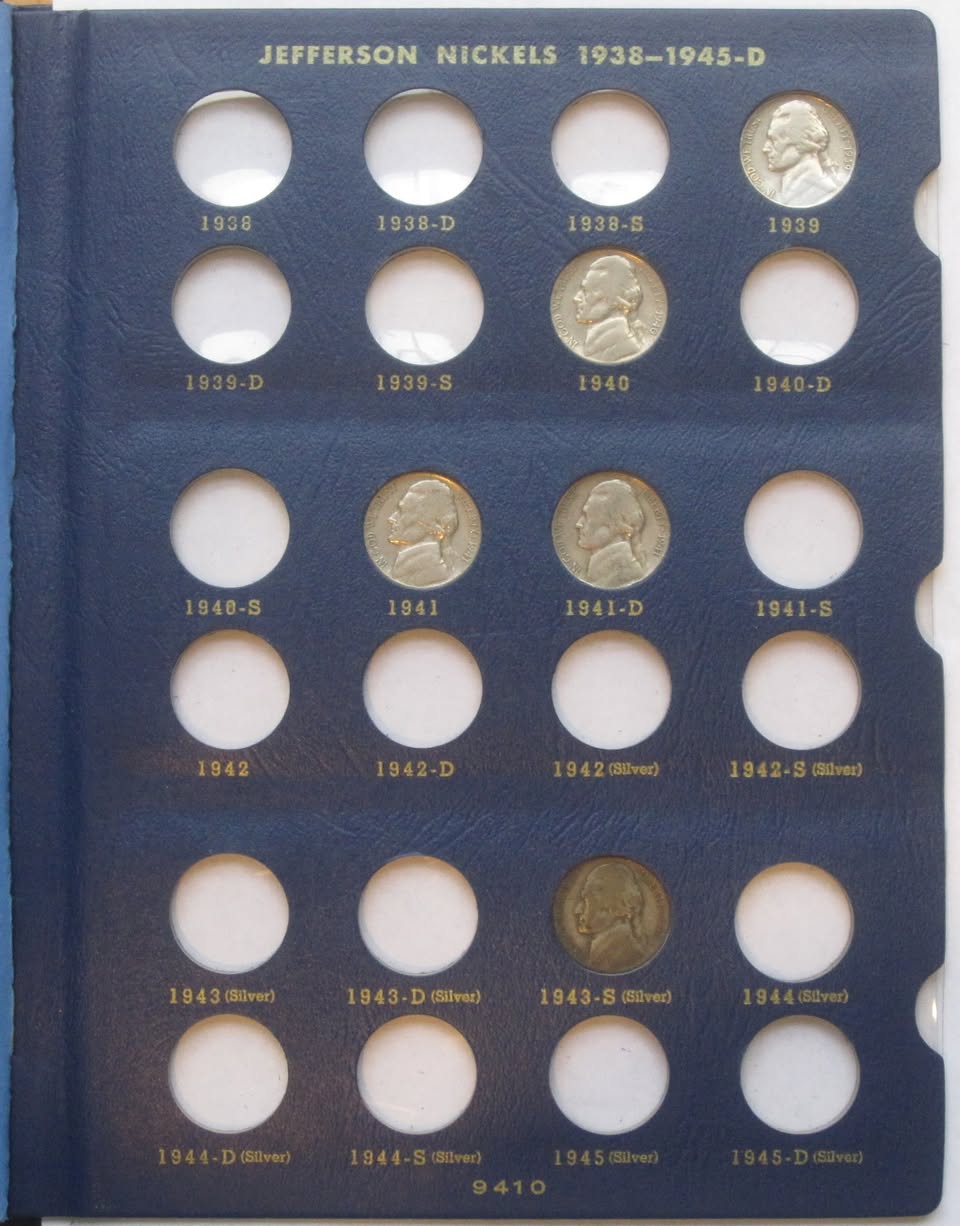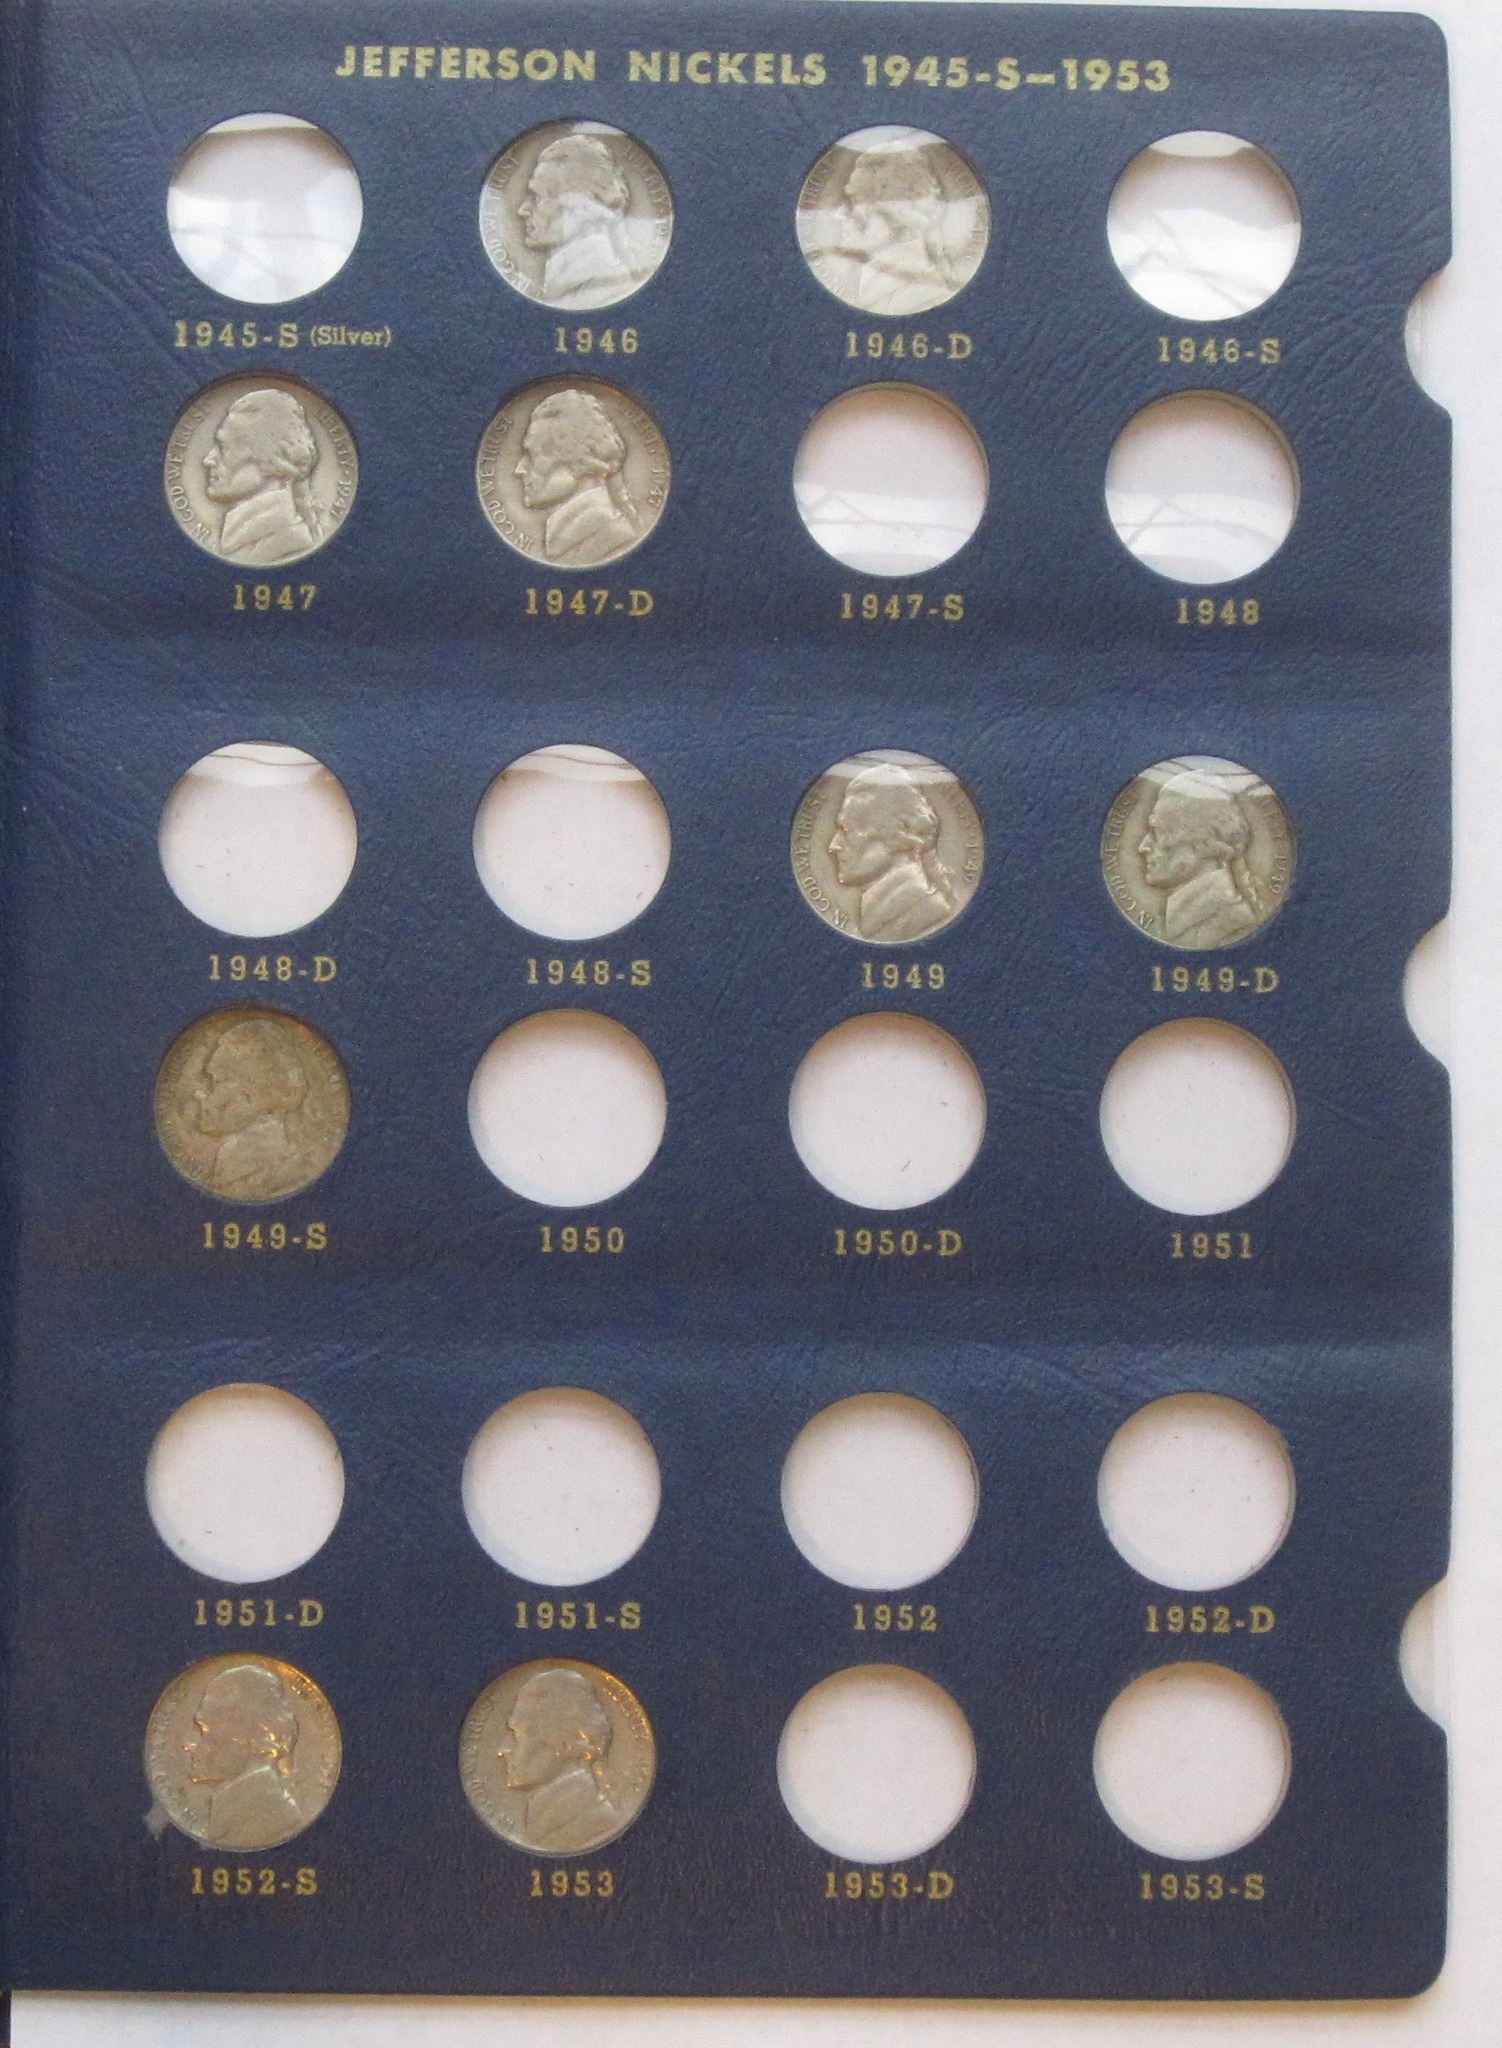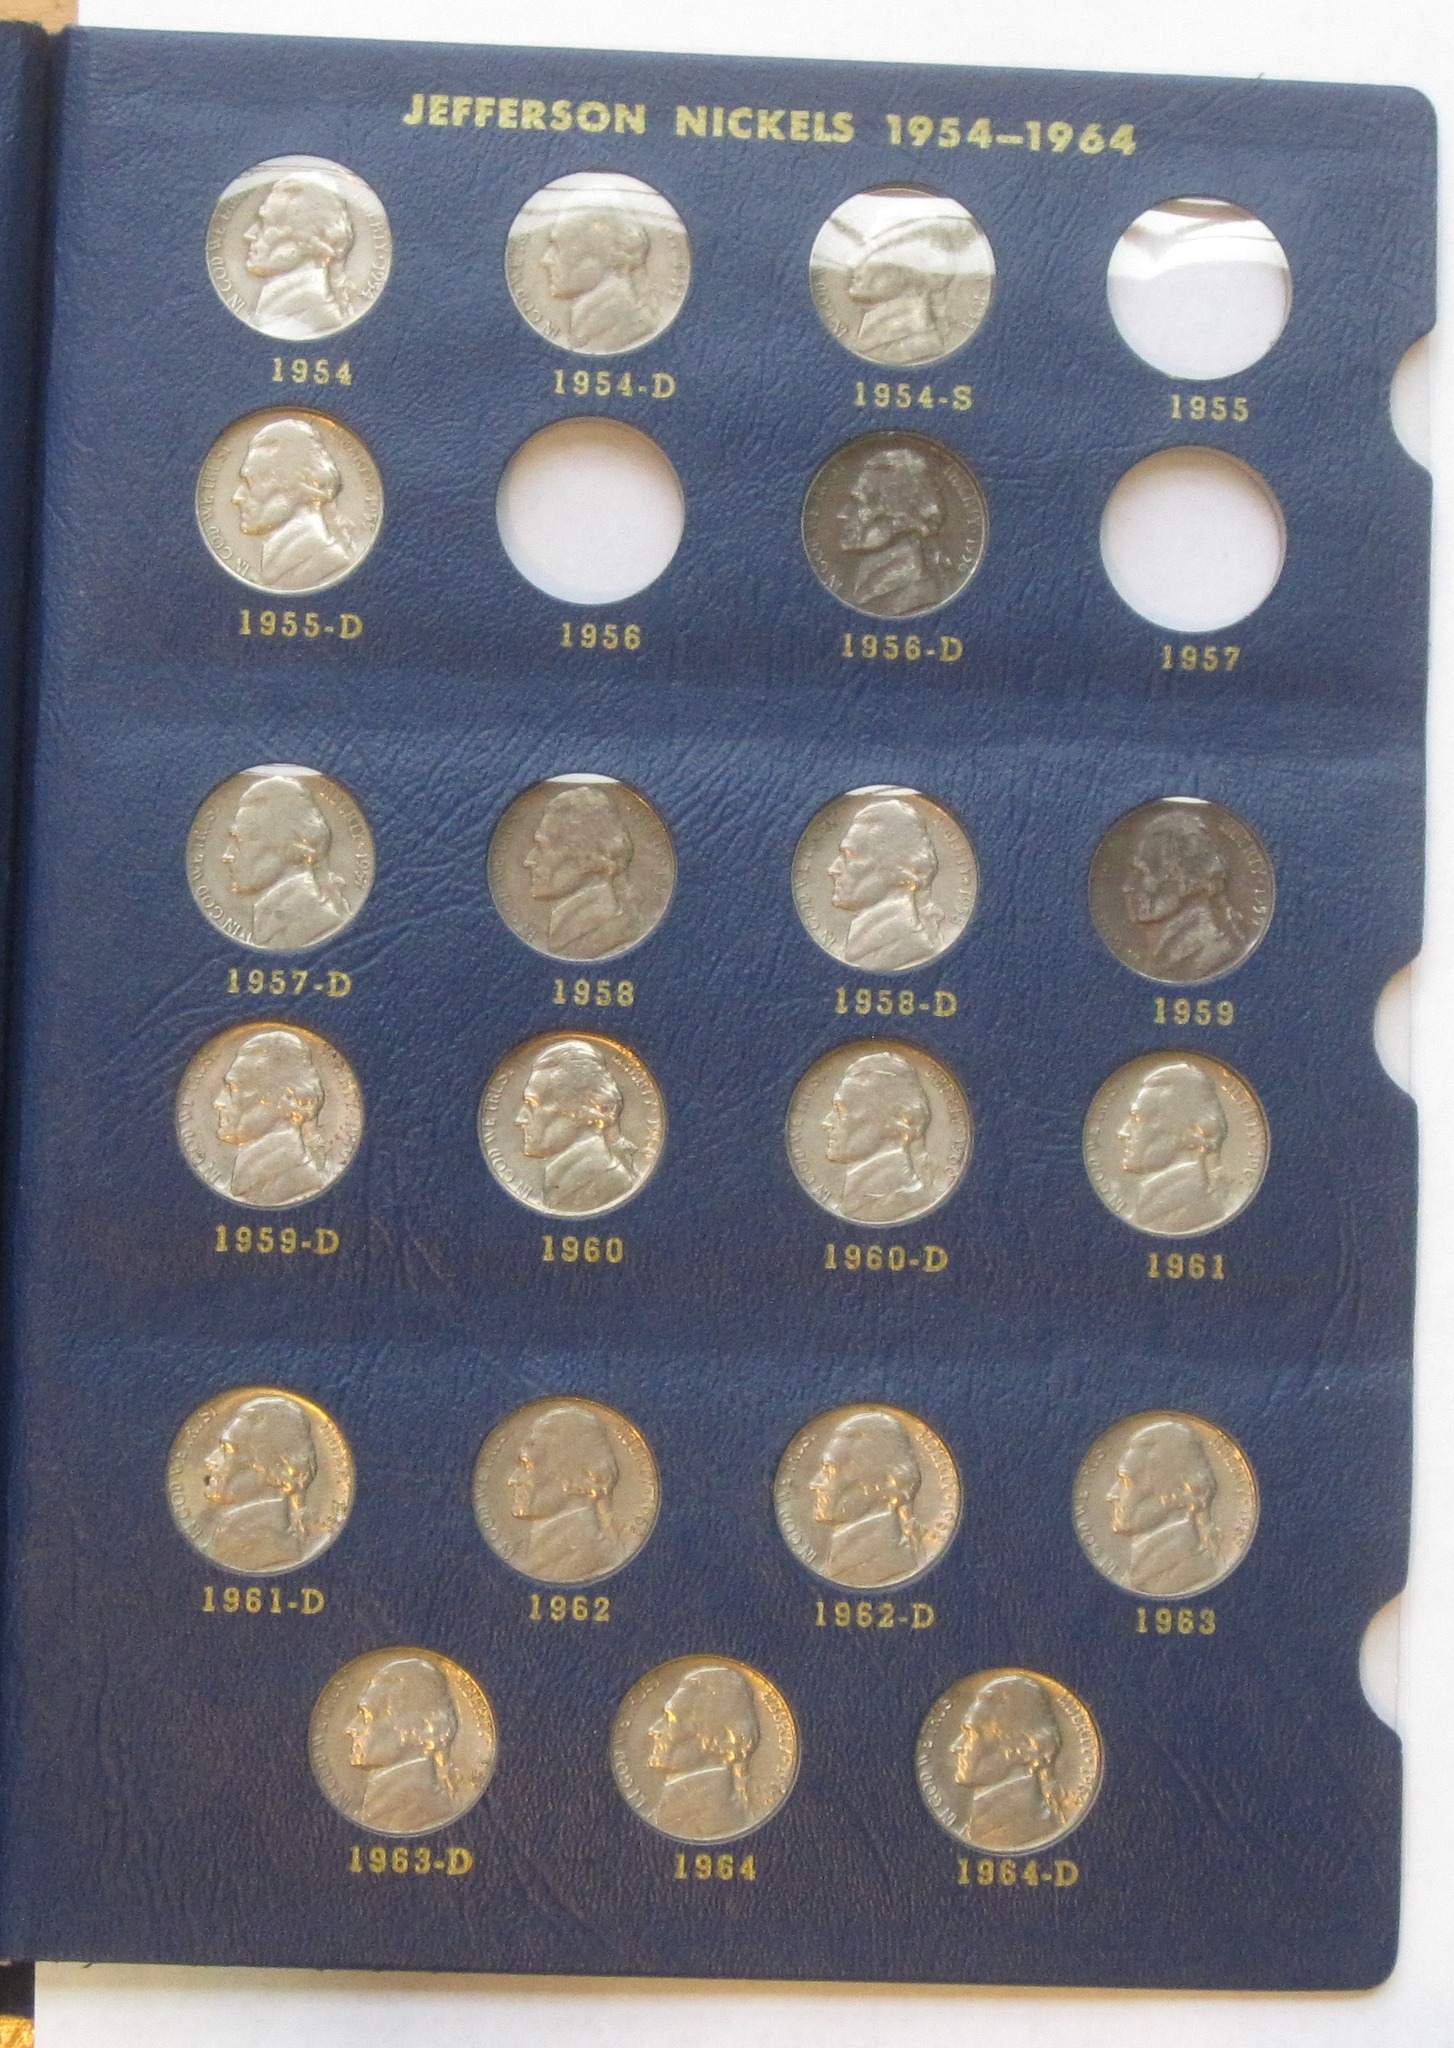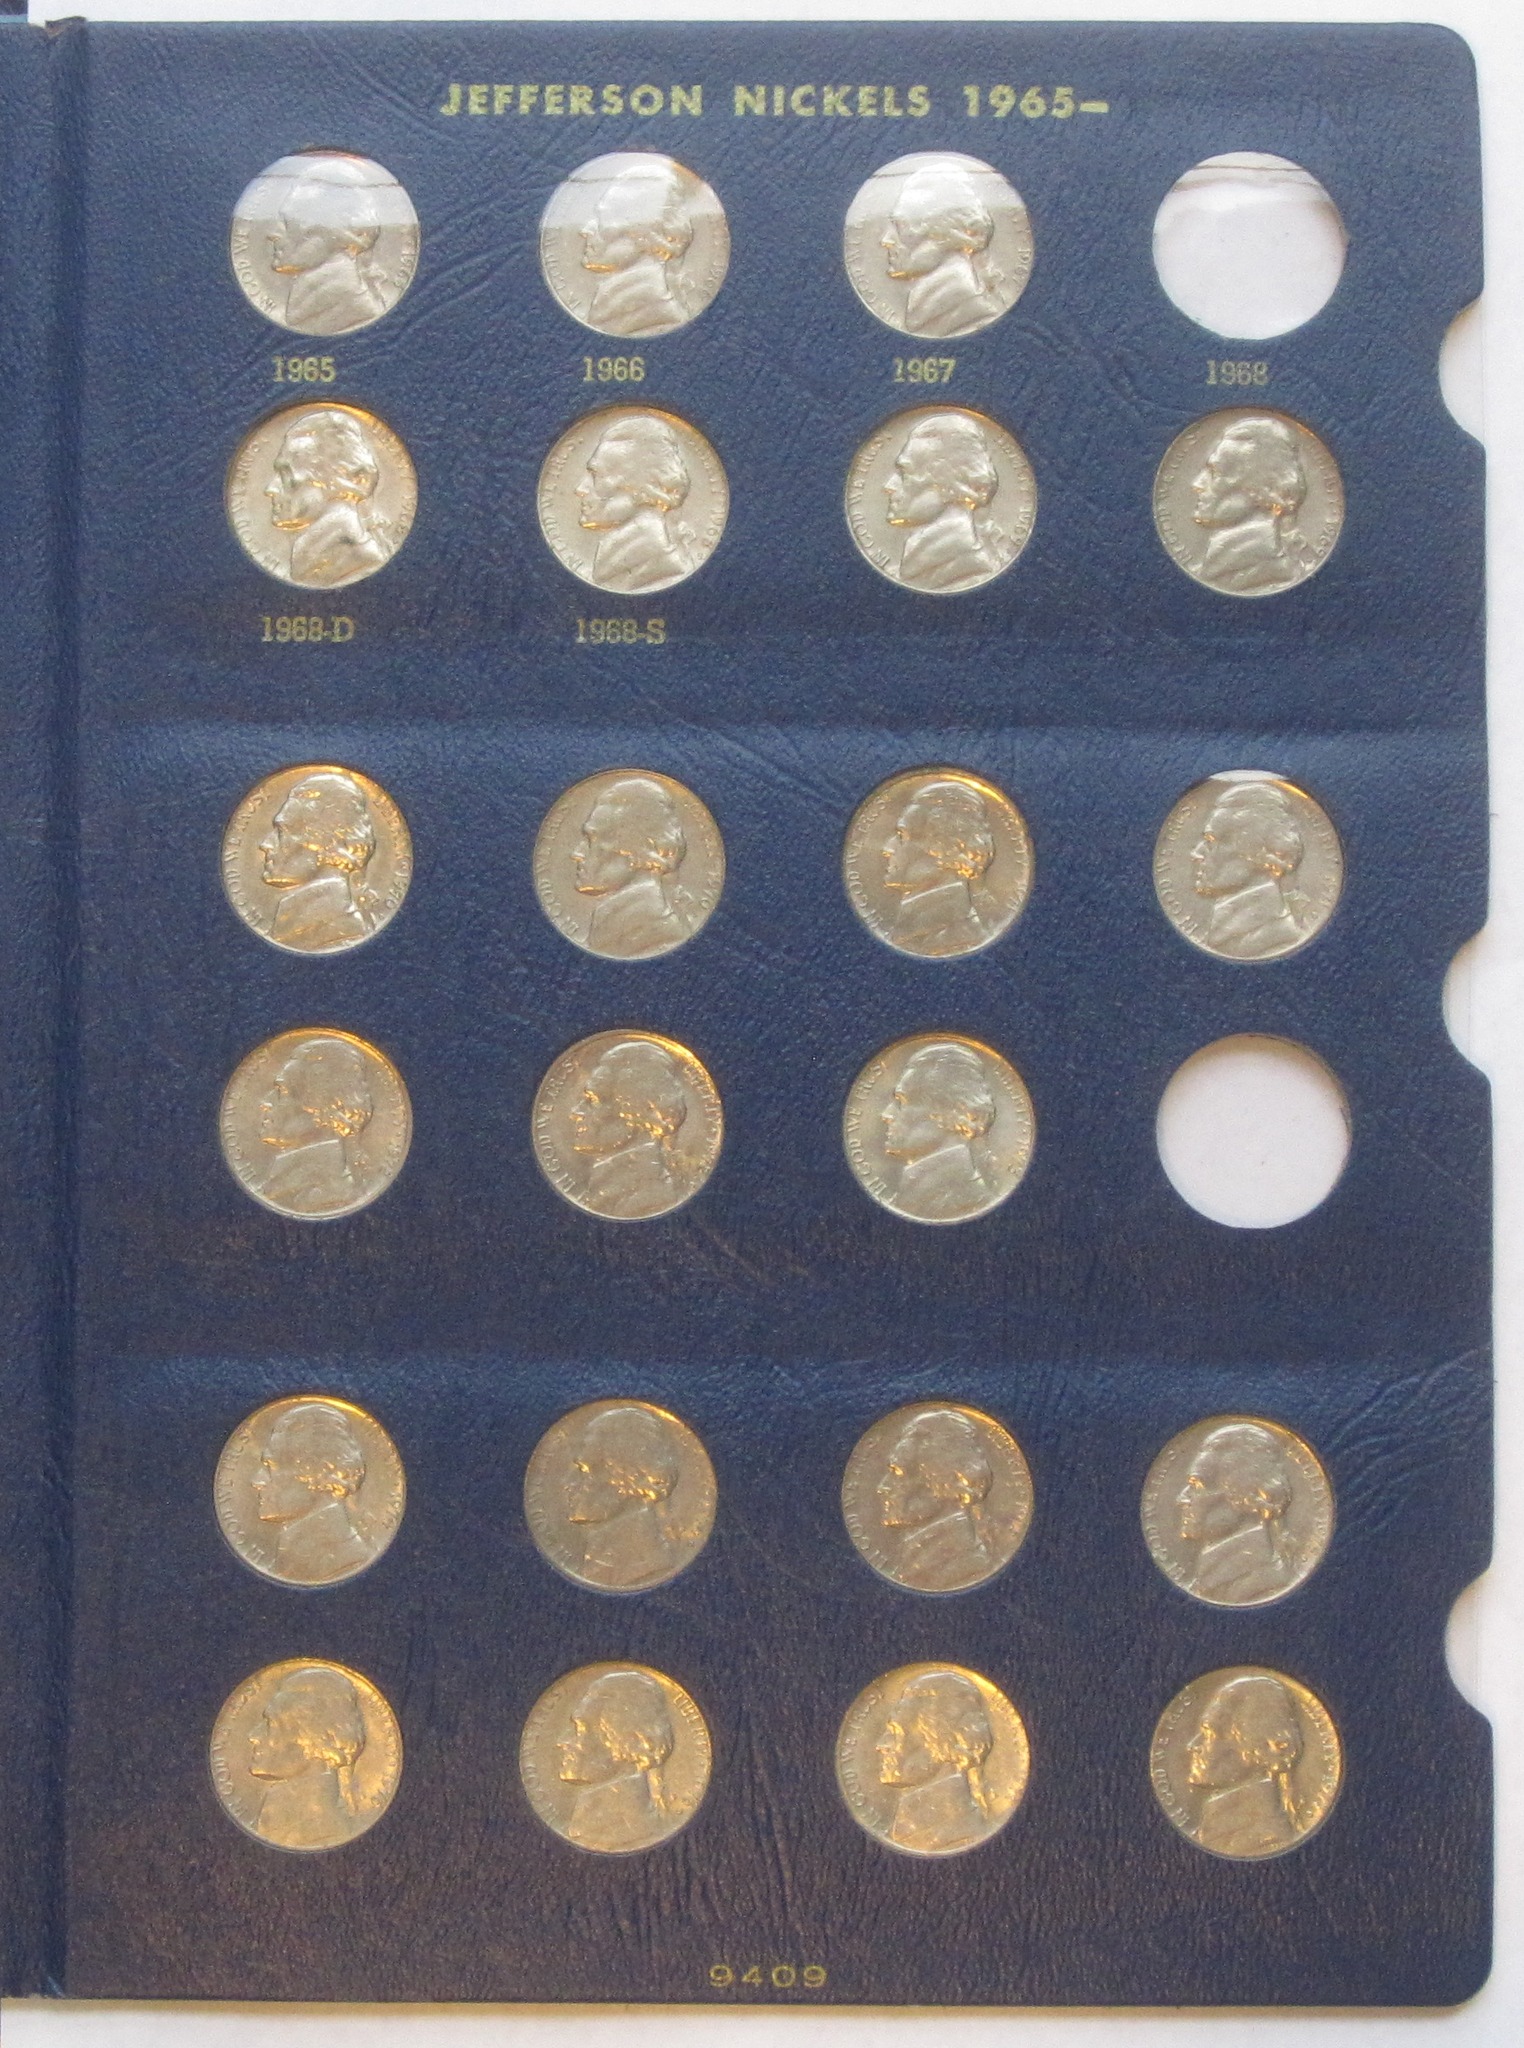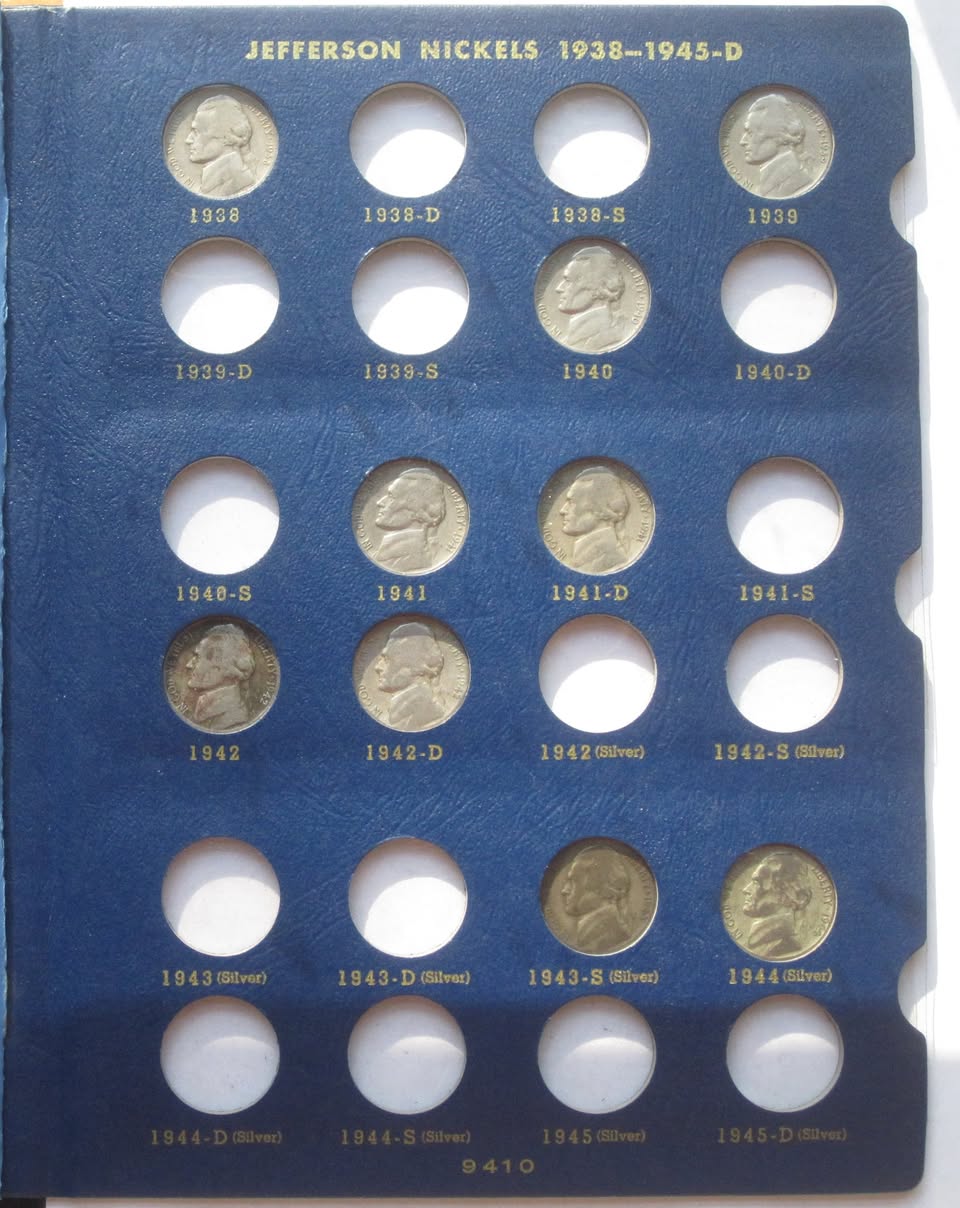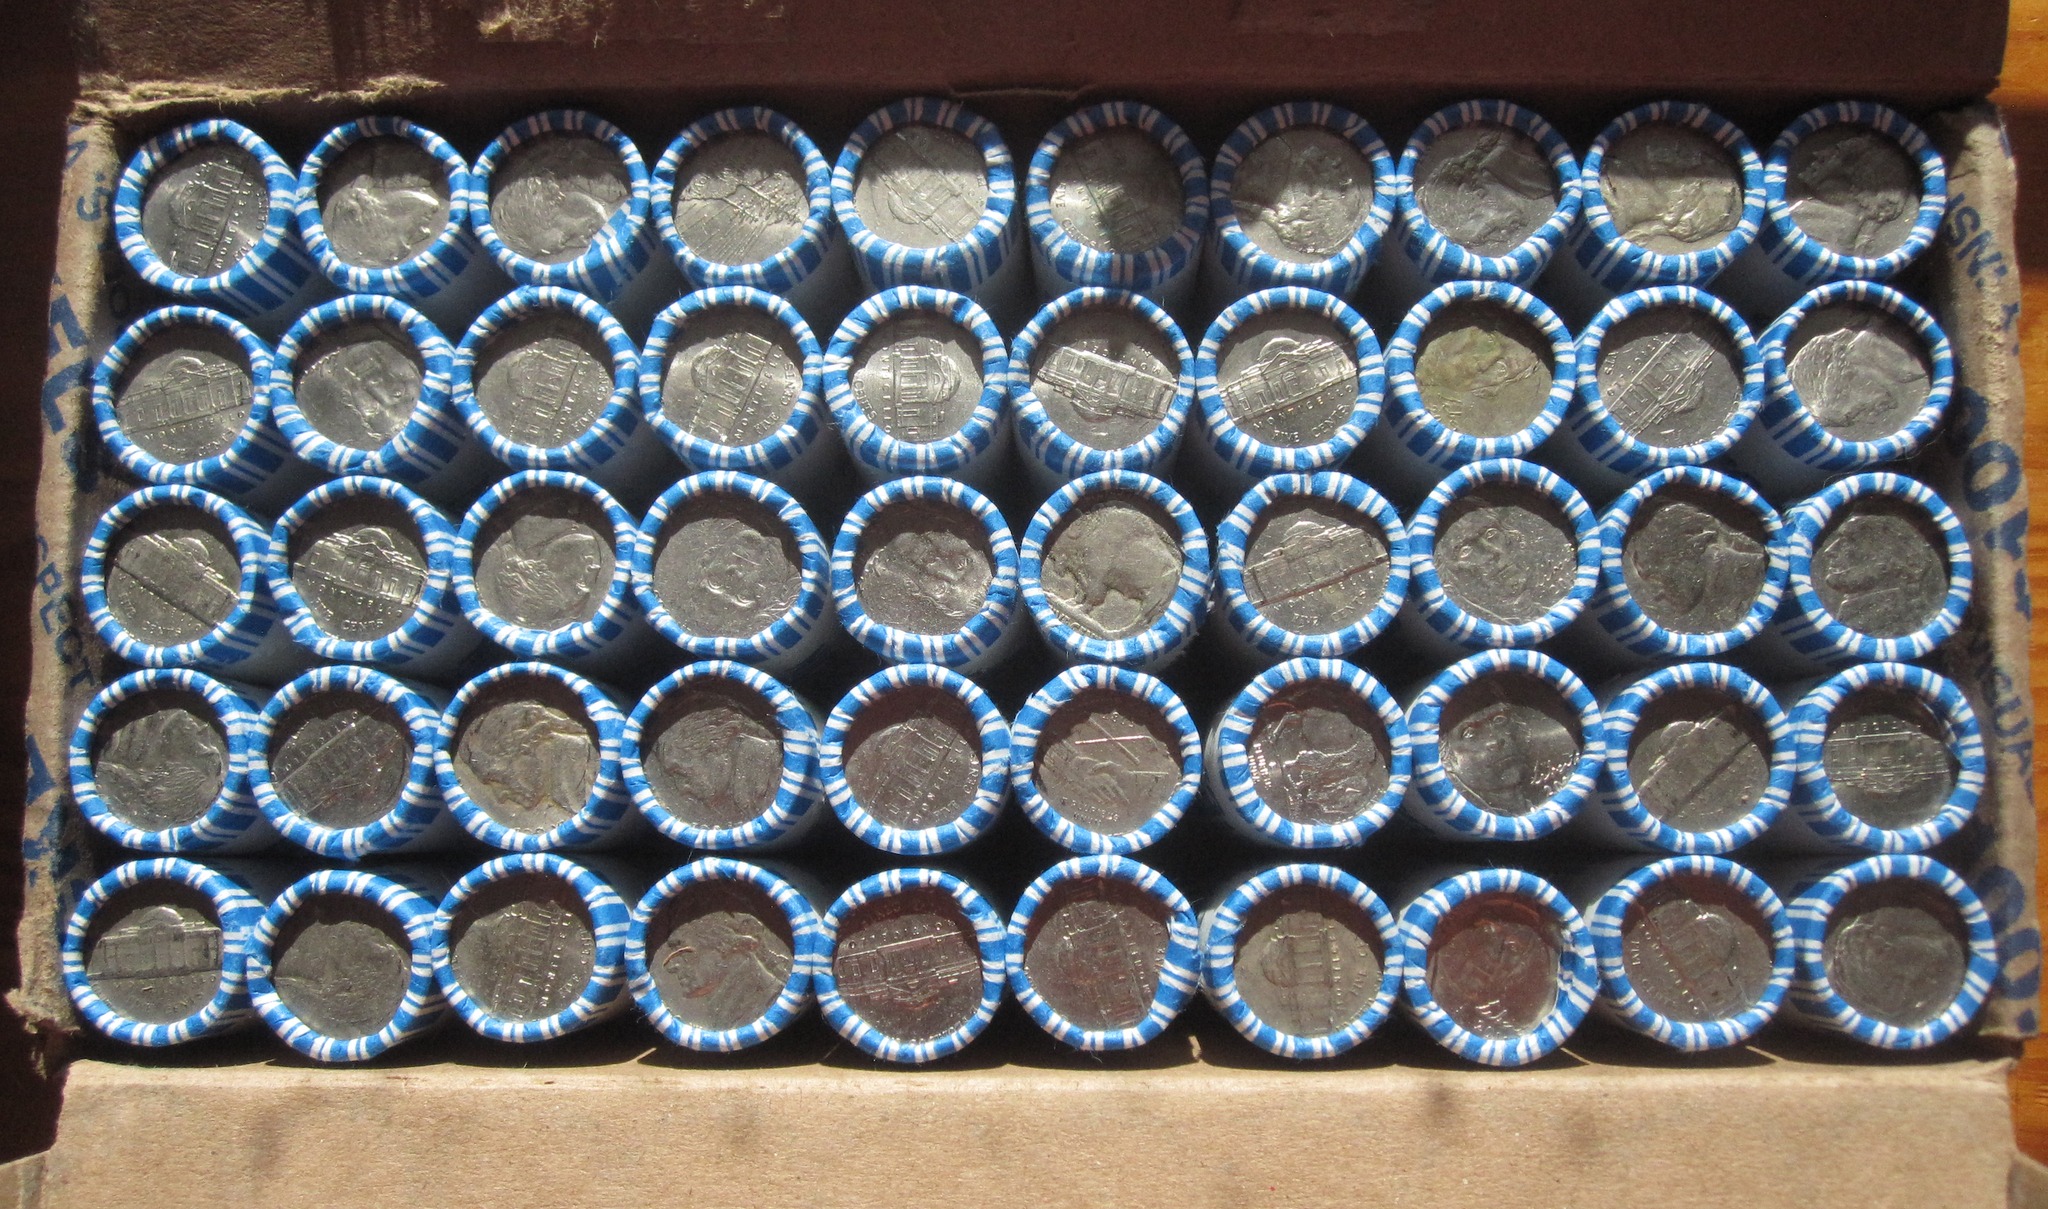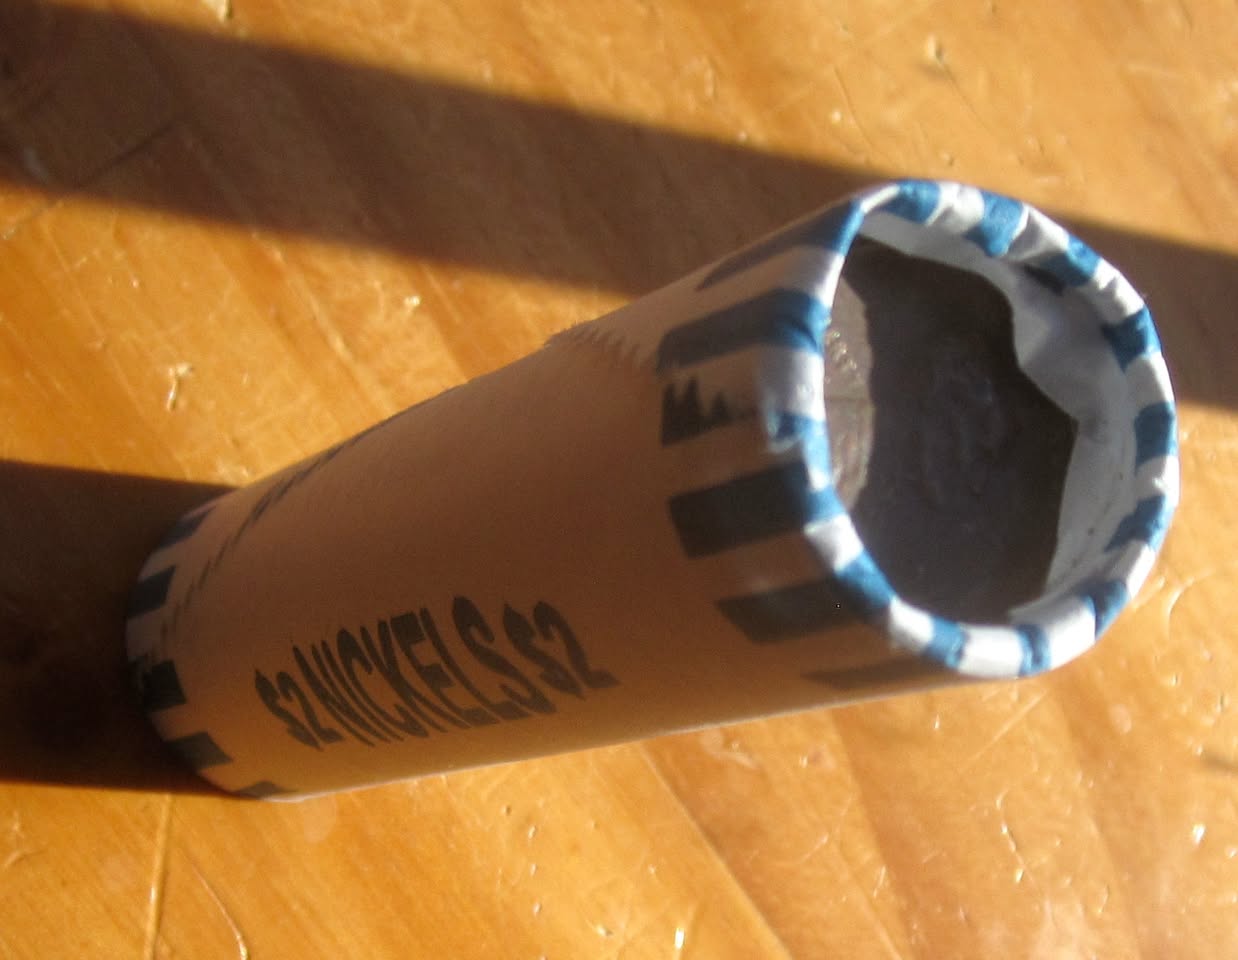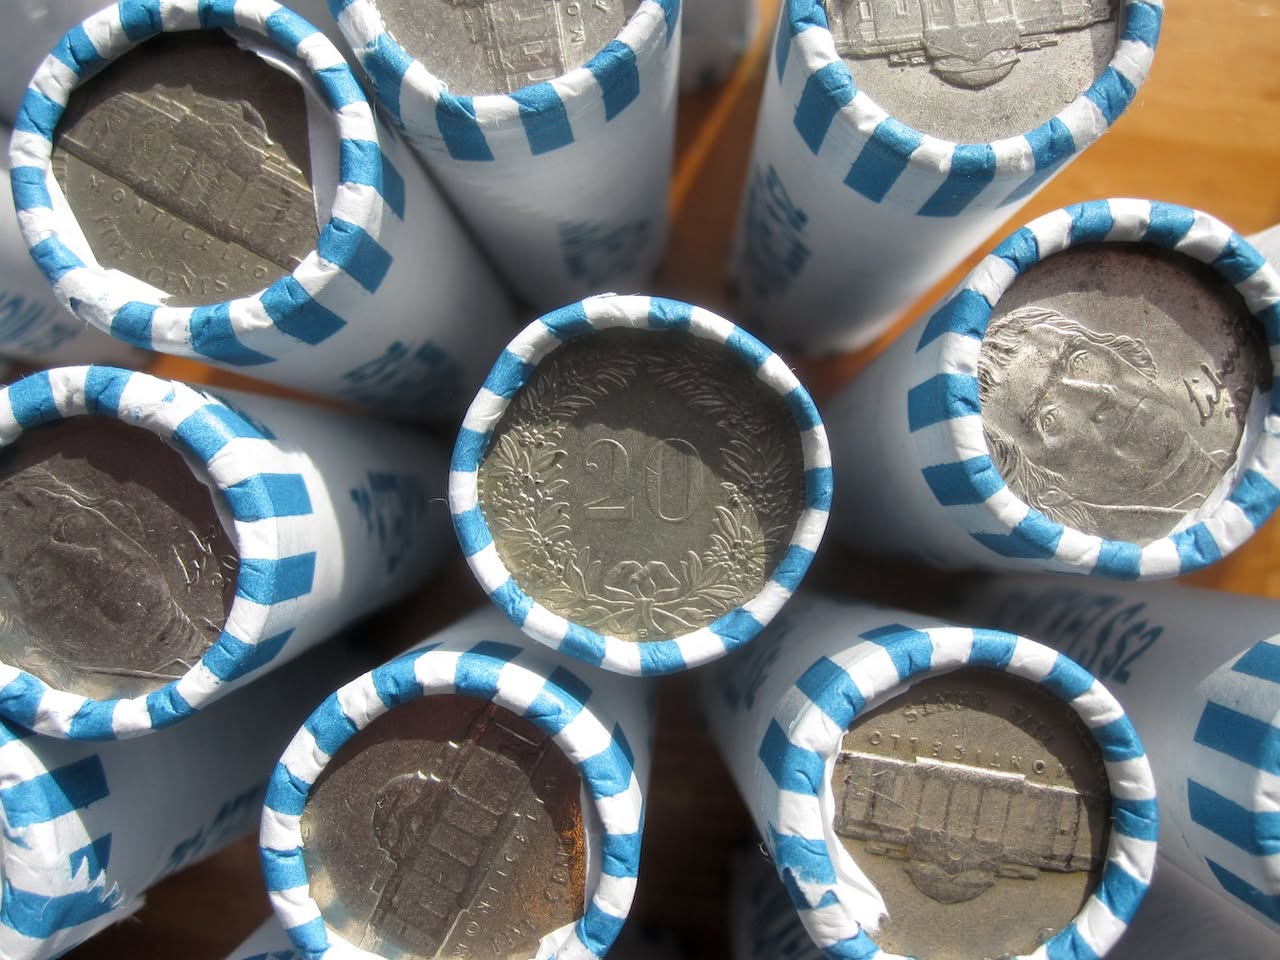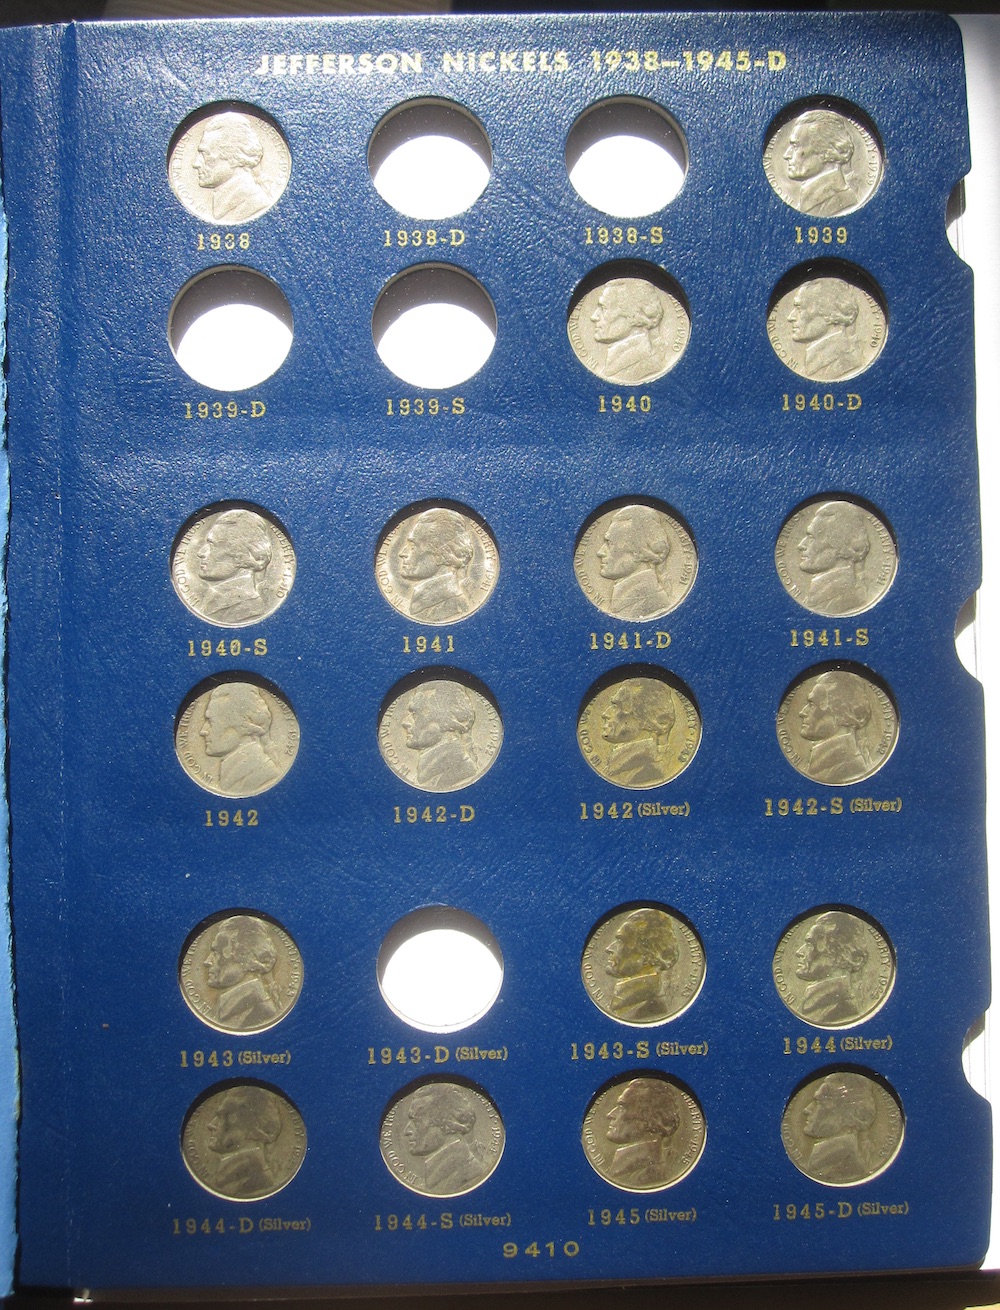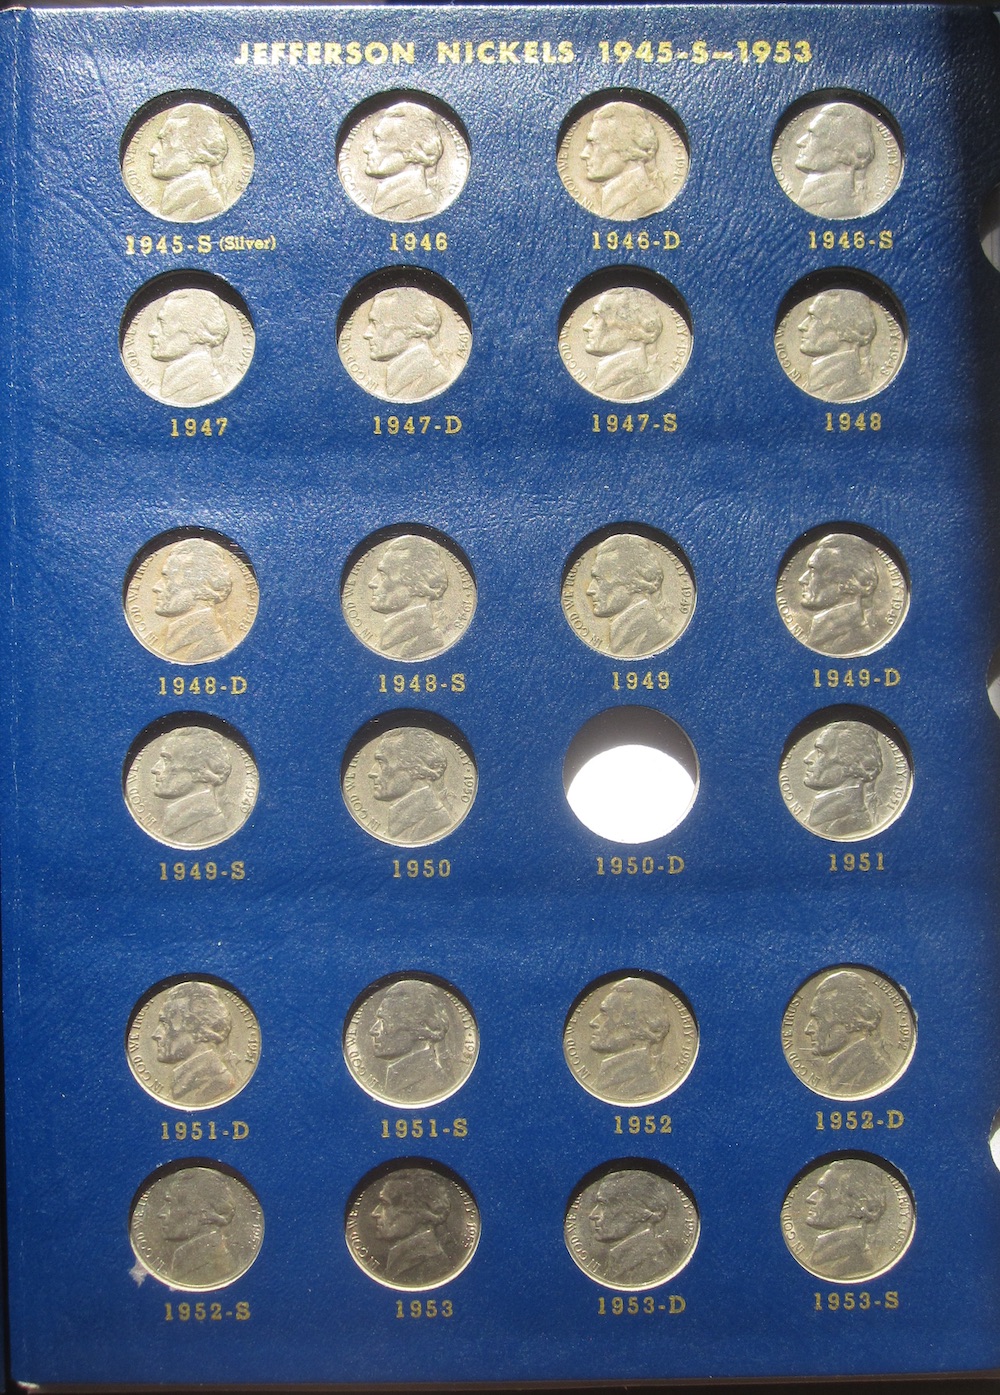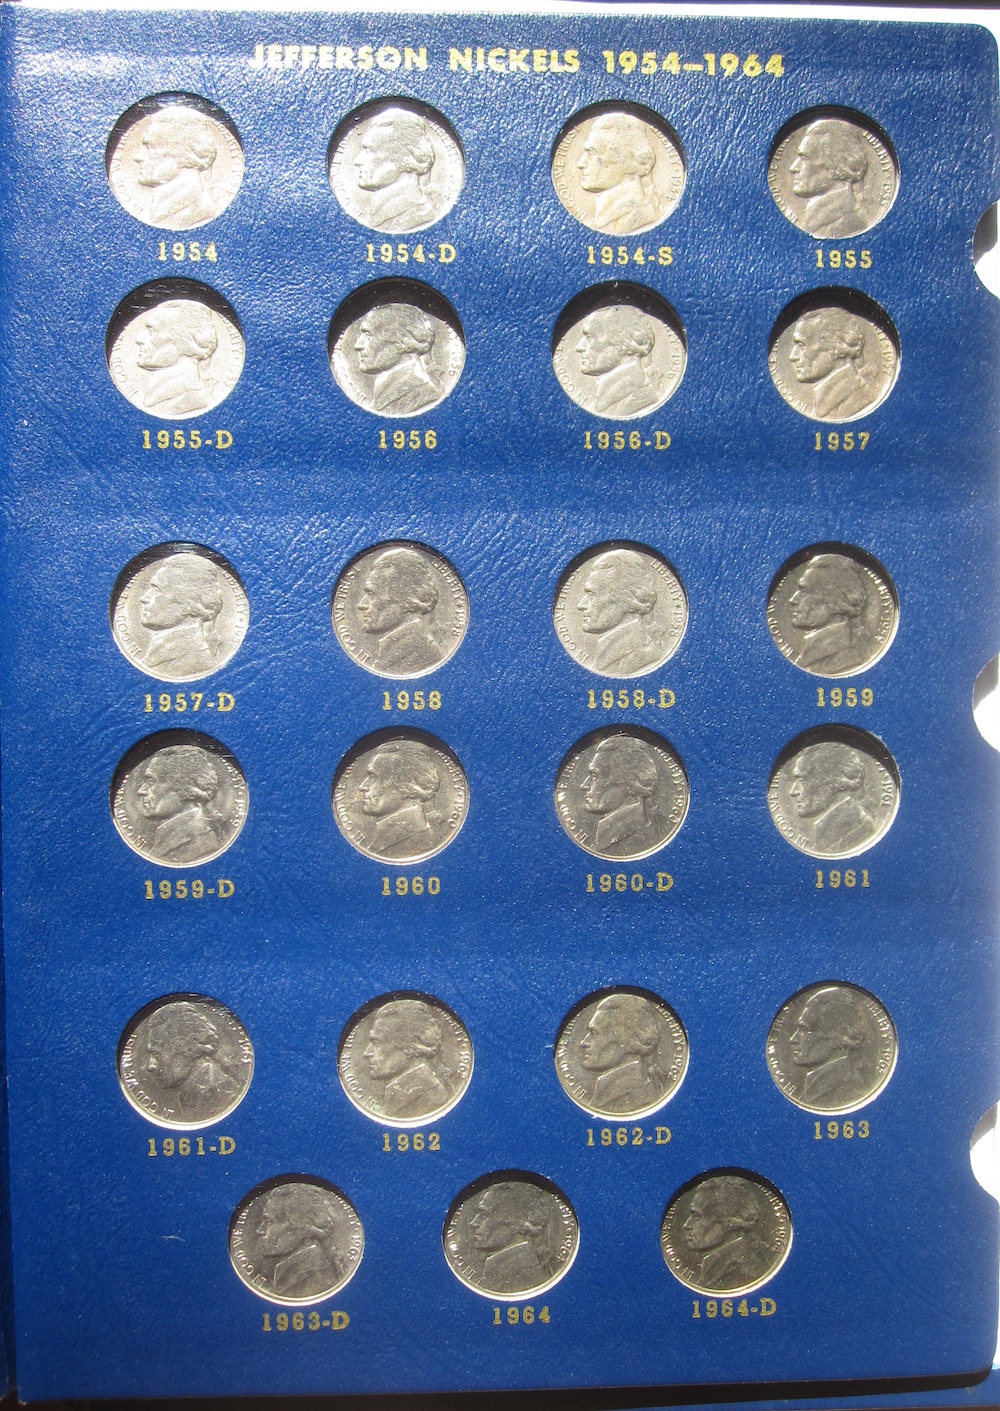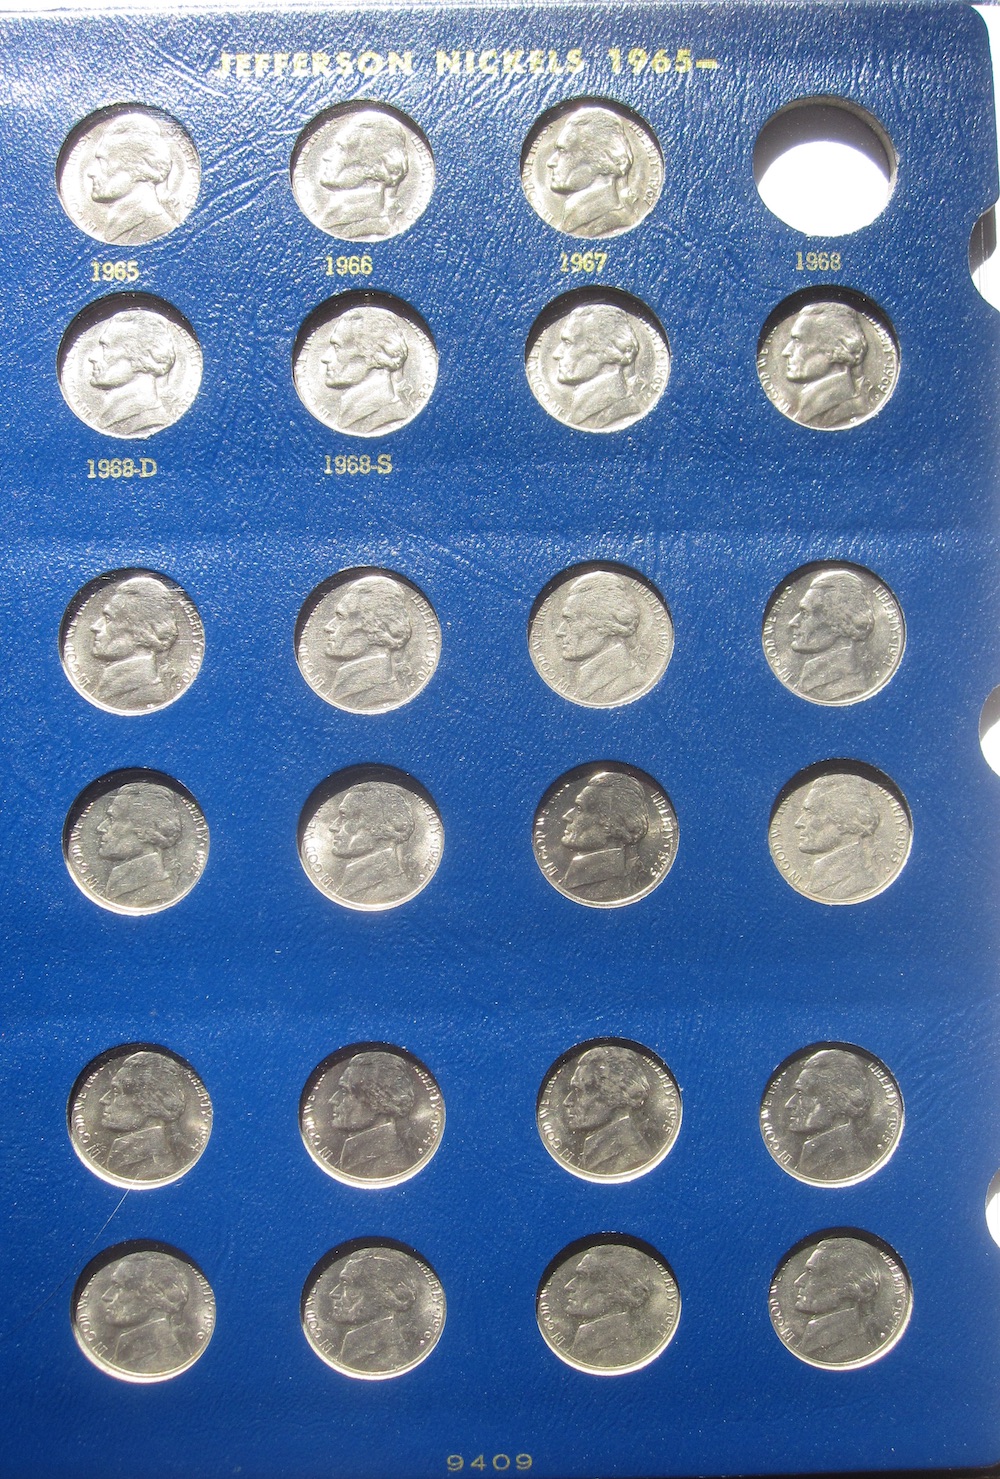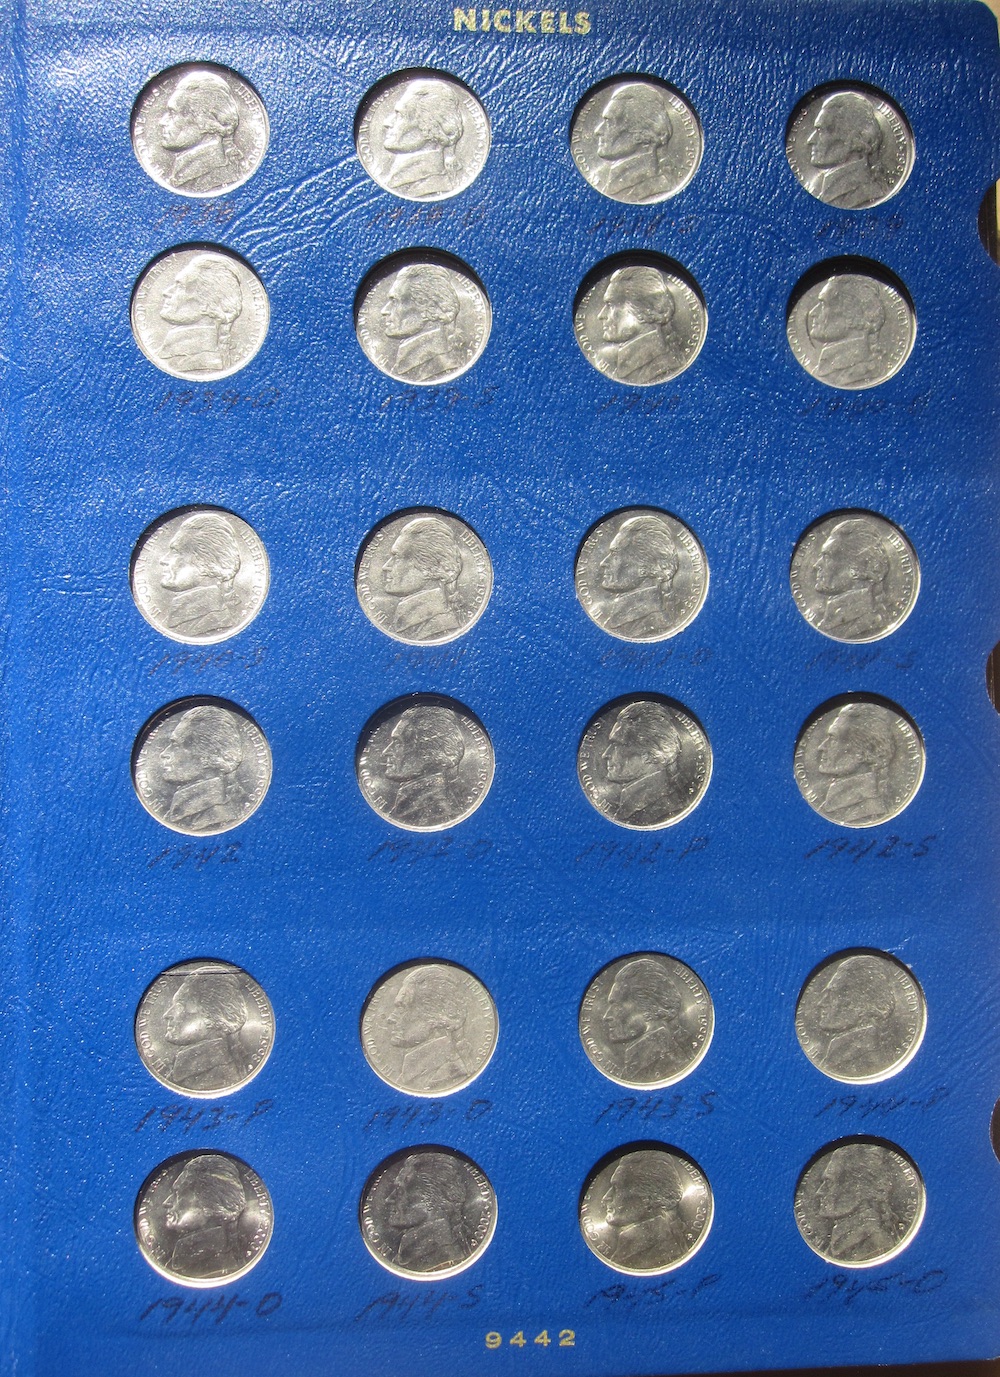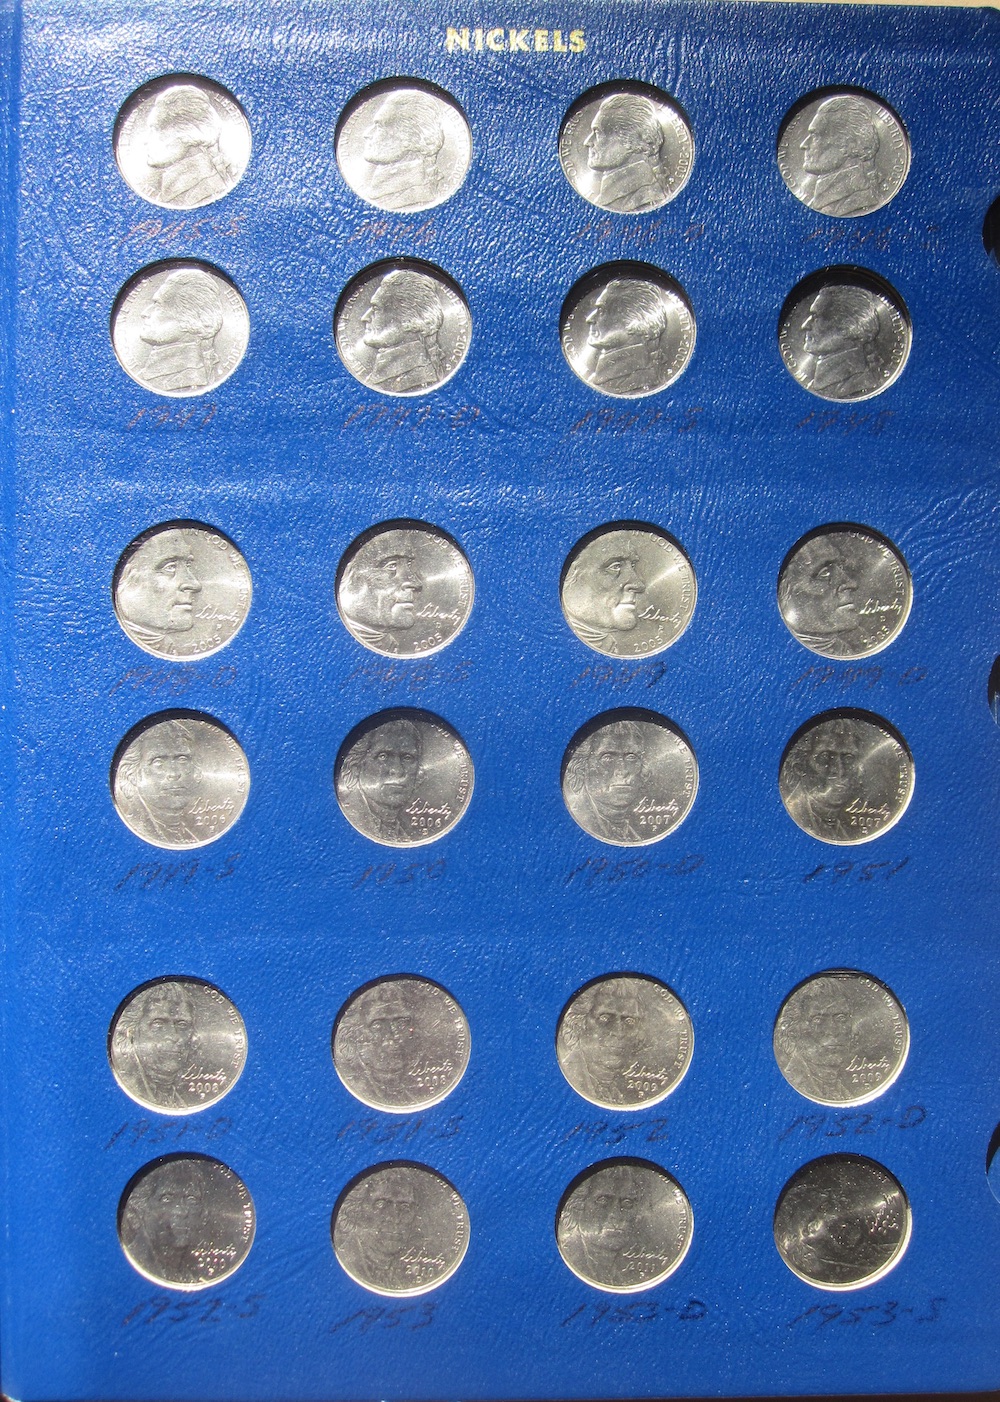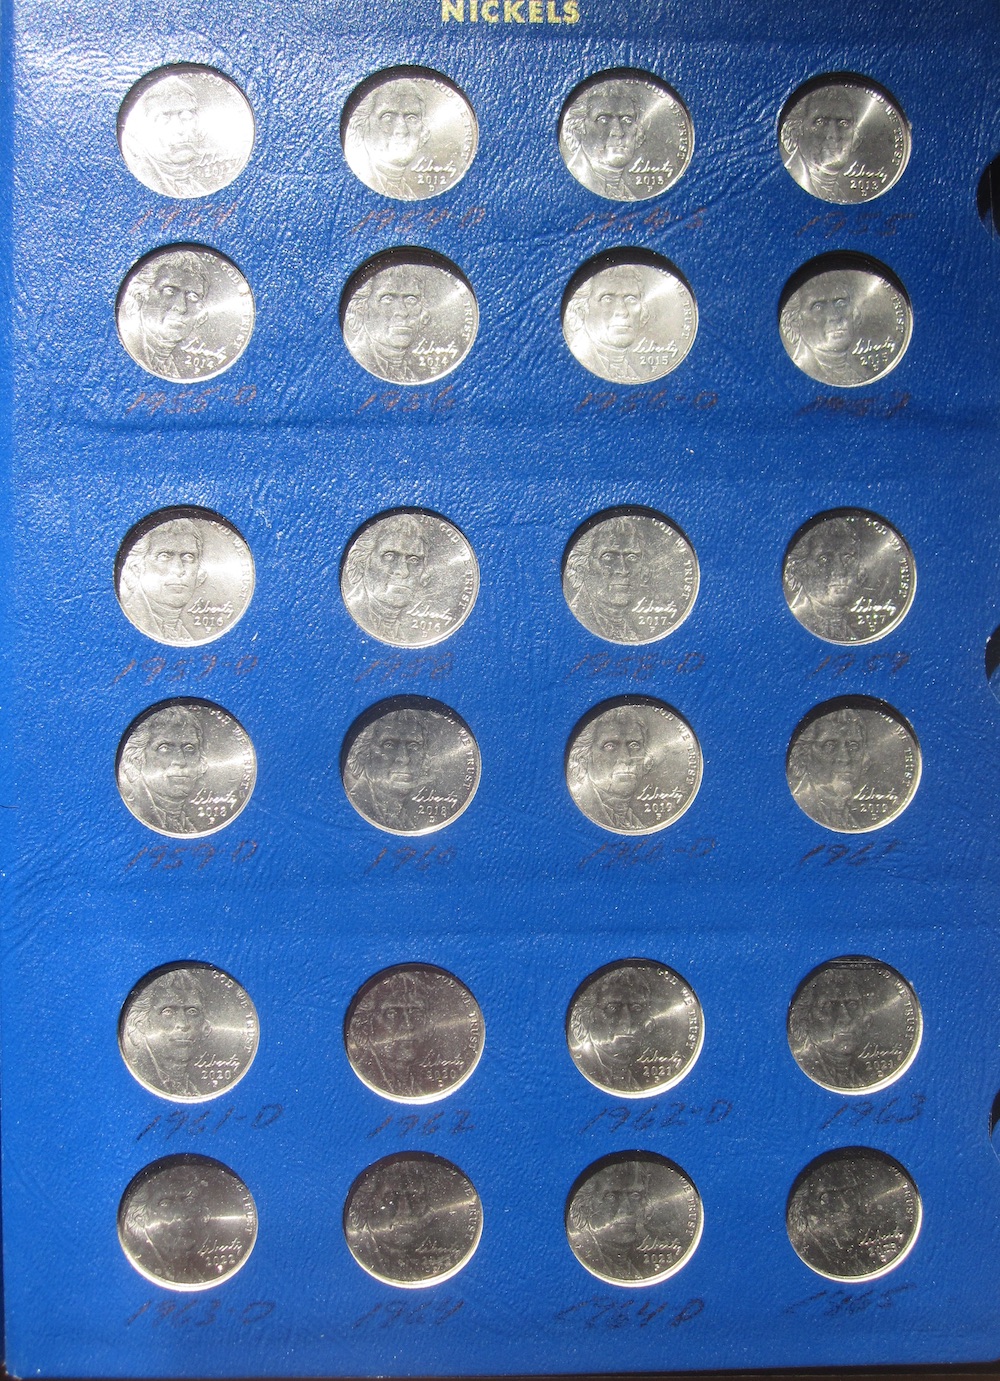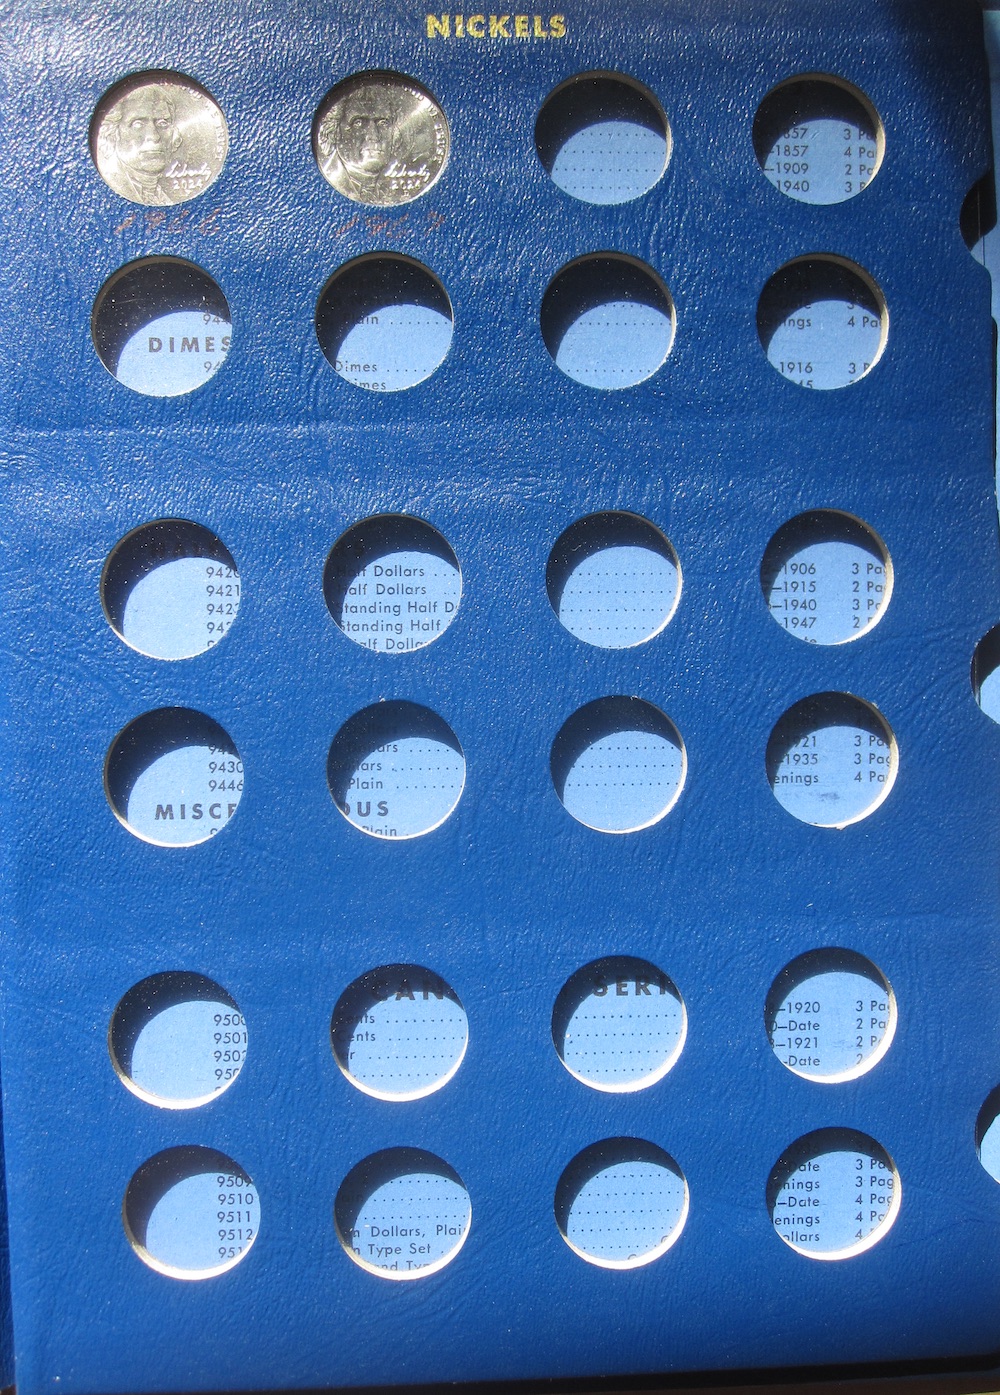
Back in October of 2024 I started a project to assemble a complete Jefferson Nickel collection (1938 to date) just from circulated coins. I started searching boxes of circulated nickels from banks. To date, I’ve searched 60 boxes of nickels. While I don’t yet have a complete collection, I am close, I am only missing six nickels out of 194: 1938D, 1938S, 1939D, 1939S, 1943D, and 1950D.
Along the way, I’ve recorded some data about the nickels I’ve found, which I think helps to estimate the survivorship of older nickels still in circulation.
You may wish to refer to my previous post Assembling A Complete Jefferson Nickel Collection Just From Circulation, where I detail the results of each box searched.
This table shows a list of which “special” coins were found in each box, at the bottom are totals along with a per-box average for each type.
| Box | Date | Shield | Liberty | Buffalo | War | Proof | Canadian | Bermuda | Other Countries |
| 1 | 1 | 3 | |||||||
| 2 | 1 | 2 | Bahamas | ||||||
| 3 | |||||||||
| 4 | |||||||||
| 5 | |||||||||
| 6 | 2 | 1 | |||||||
| 7 | 1 | ||||||||
| 8 | 2 | ||||||||
| 9 | 1 | ||||||||
| 10 | 1 | 1 | 1 | ||||||
| 11 | 1 | 1 | 1 | ||||||
| 12 | 1 | 2 | |||||||
| 13 | |||||||||
| 14 | |||||||||
| 15 | |||||||||
| 16 | |||||||||
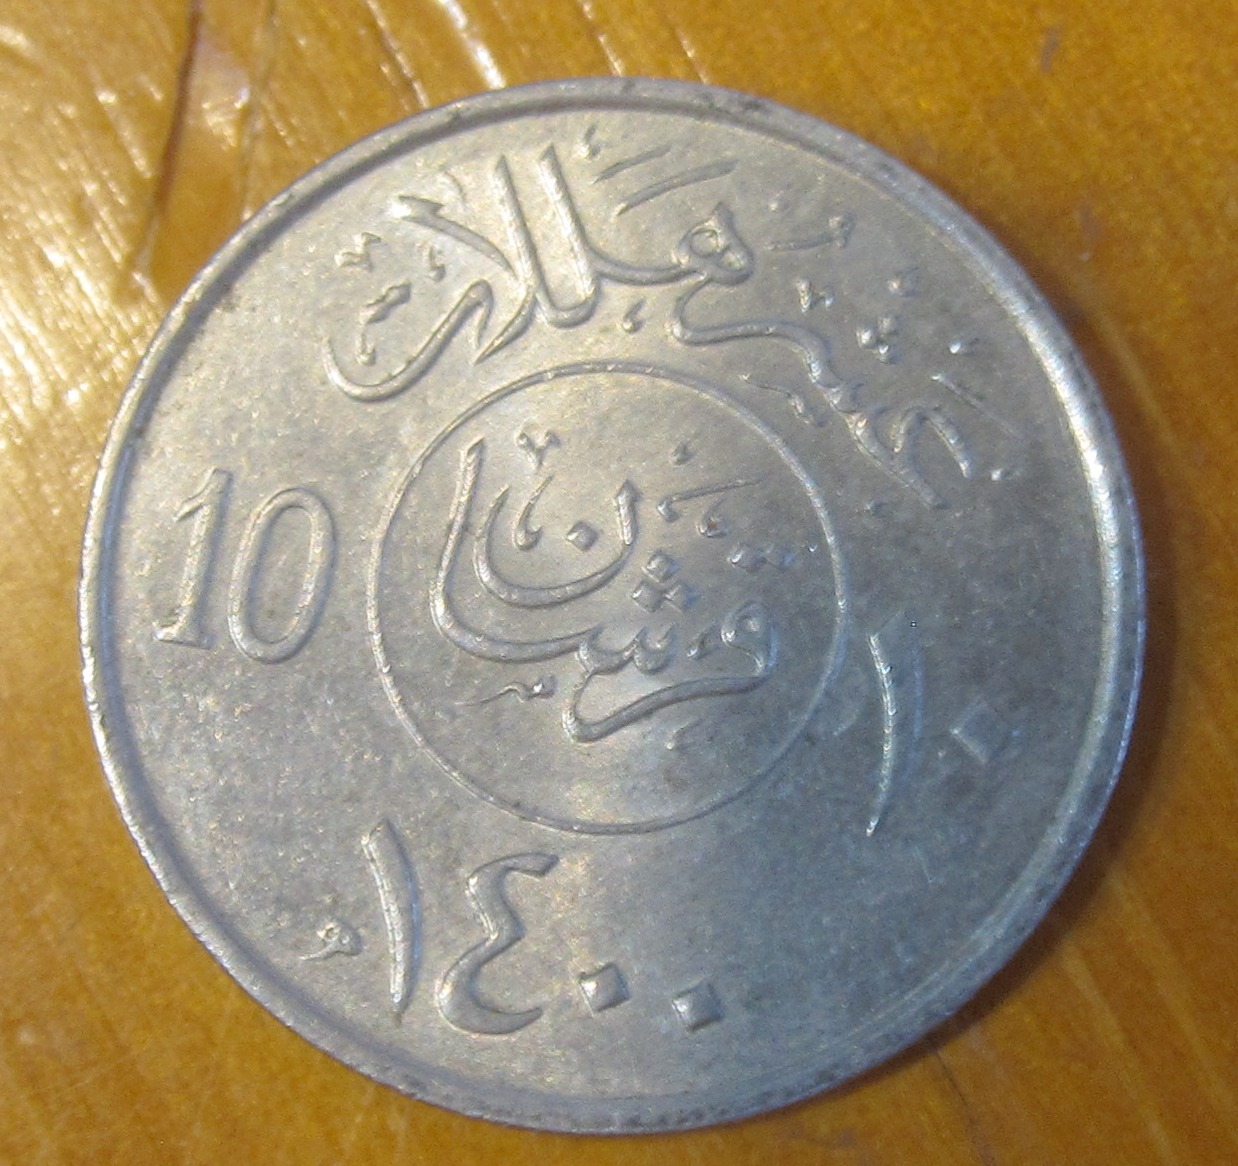
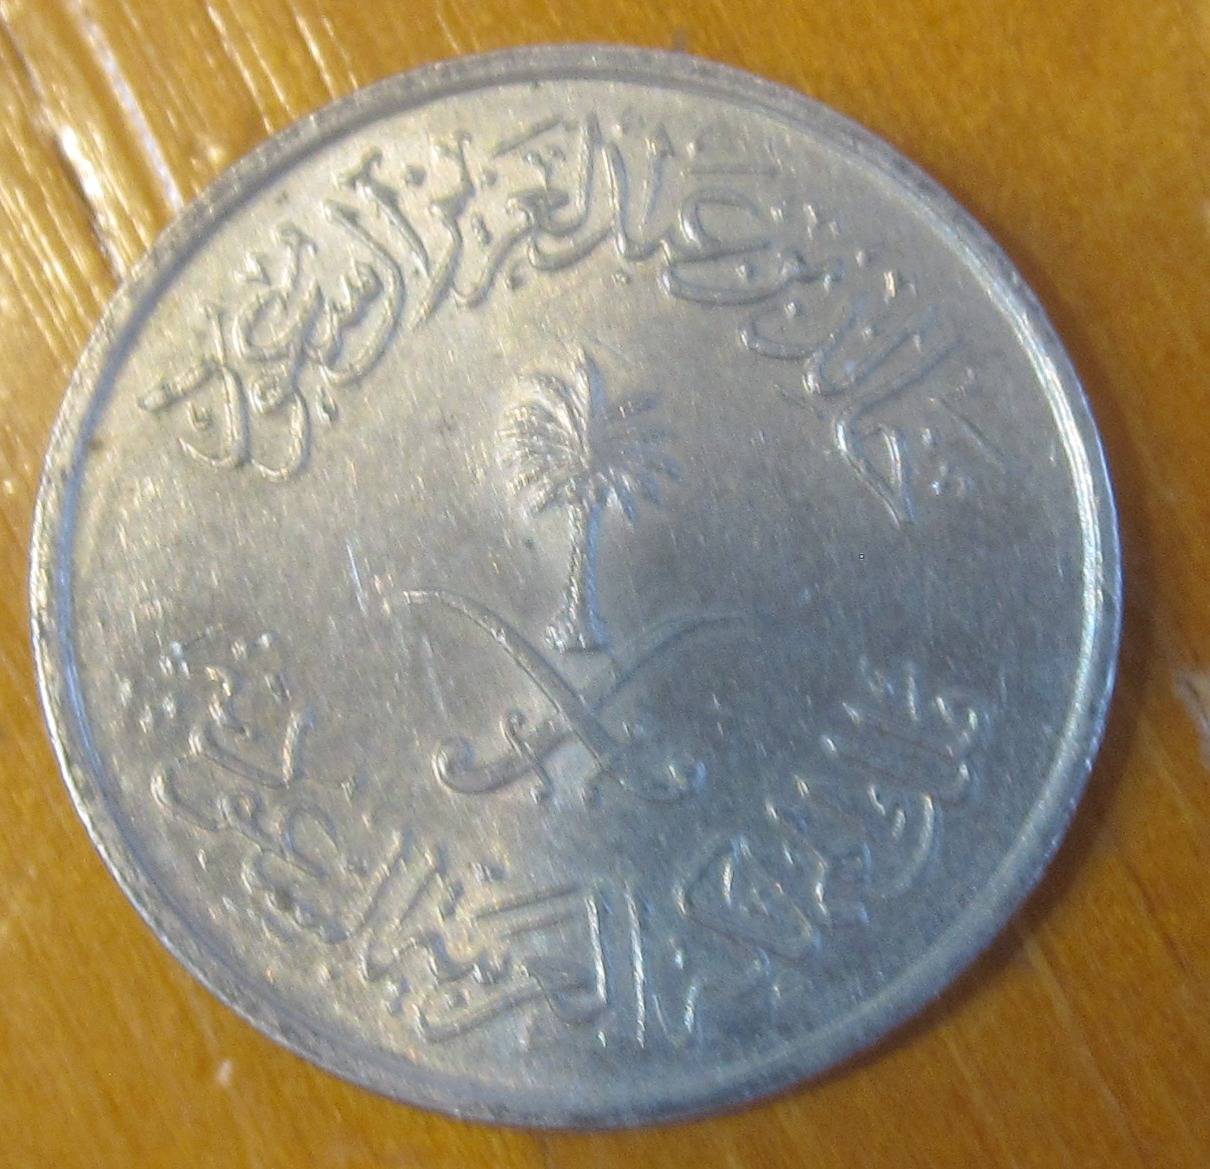
| 17 | Saudi Arabia | ||||||||
| 18 | 1 | ||||||||
| 19 | 1 | ||||||||
| 20 | 1 | 2 | |||||||
| 21 | 1 | ||||||||
| 22 | 1 | ||||||||
| 23 | 1 | ||||||||
| 24 | 1 | 1 | 1 | ||||||
| 25 | 1 | ||||||||
| 26 | 2 | ||||||||
| 27 | 2 | 2 | 2 | ||||||
| 28 | 1 | 1 | 1 | ||||||
| 29 | 1 | 1 | 1 | 1 | 1 | ||||
| 30 | 2 | 6 | 2 | 2 | |||||
| 31 | 1 | ||||||||
| 32 | 1 | 1 | |||||||
| 33 | 1 | 1 | |||||||
| 34 | 1 | 3 | 2 | ||||||
| 35 | 1 | 2 | |||||||
| 36 | 2 | 1 | 1 | ||||||
| 37 | 2 | ||||||||
| 38 | 1 | ||||||||
| 39 | |||||||||
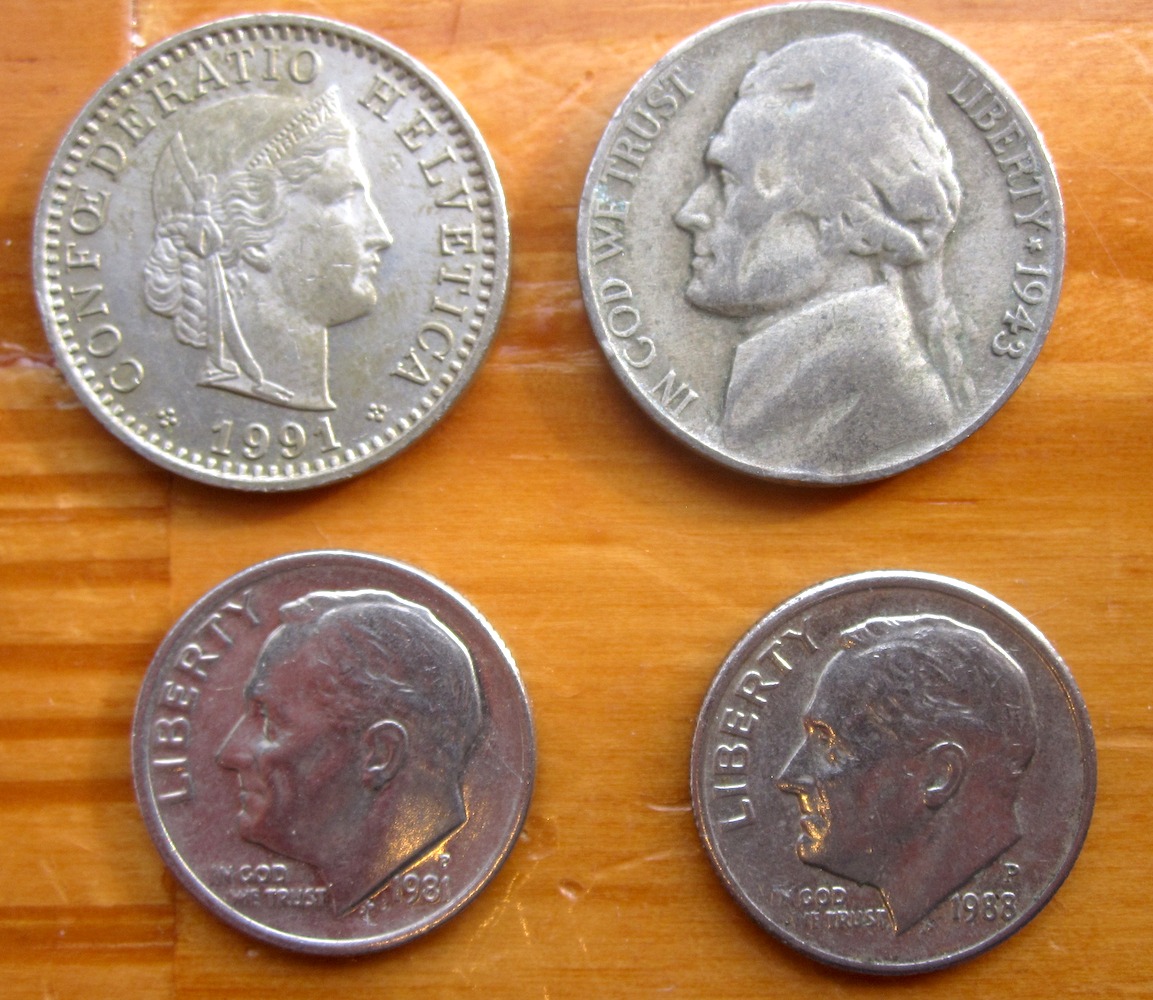
| 40 | 1 | Swiss | |||||||
| 41 | 1 | 1 | |||||||
| 42 | 1 | ||||||||
| 43 | 1 | 1 | |||||||
| 44 | 1 | 1 | |||||||
| 45 | |||||||||
| 46 | 1 | ||||||||
| 47 | 1 | ||||||||
| 48 | 2 | 1 | |||||||
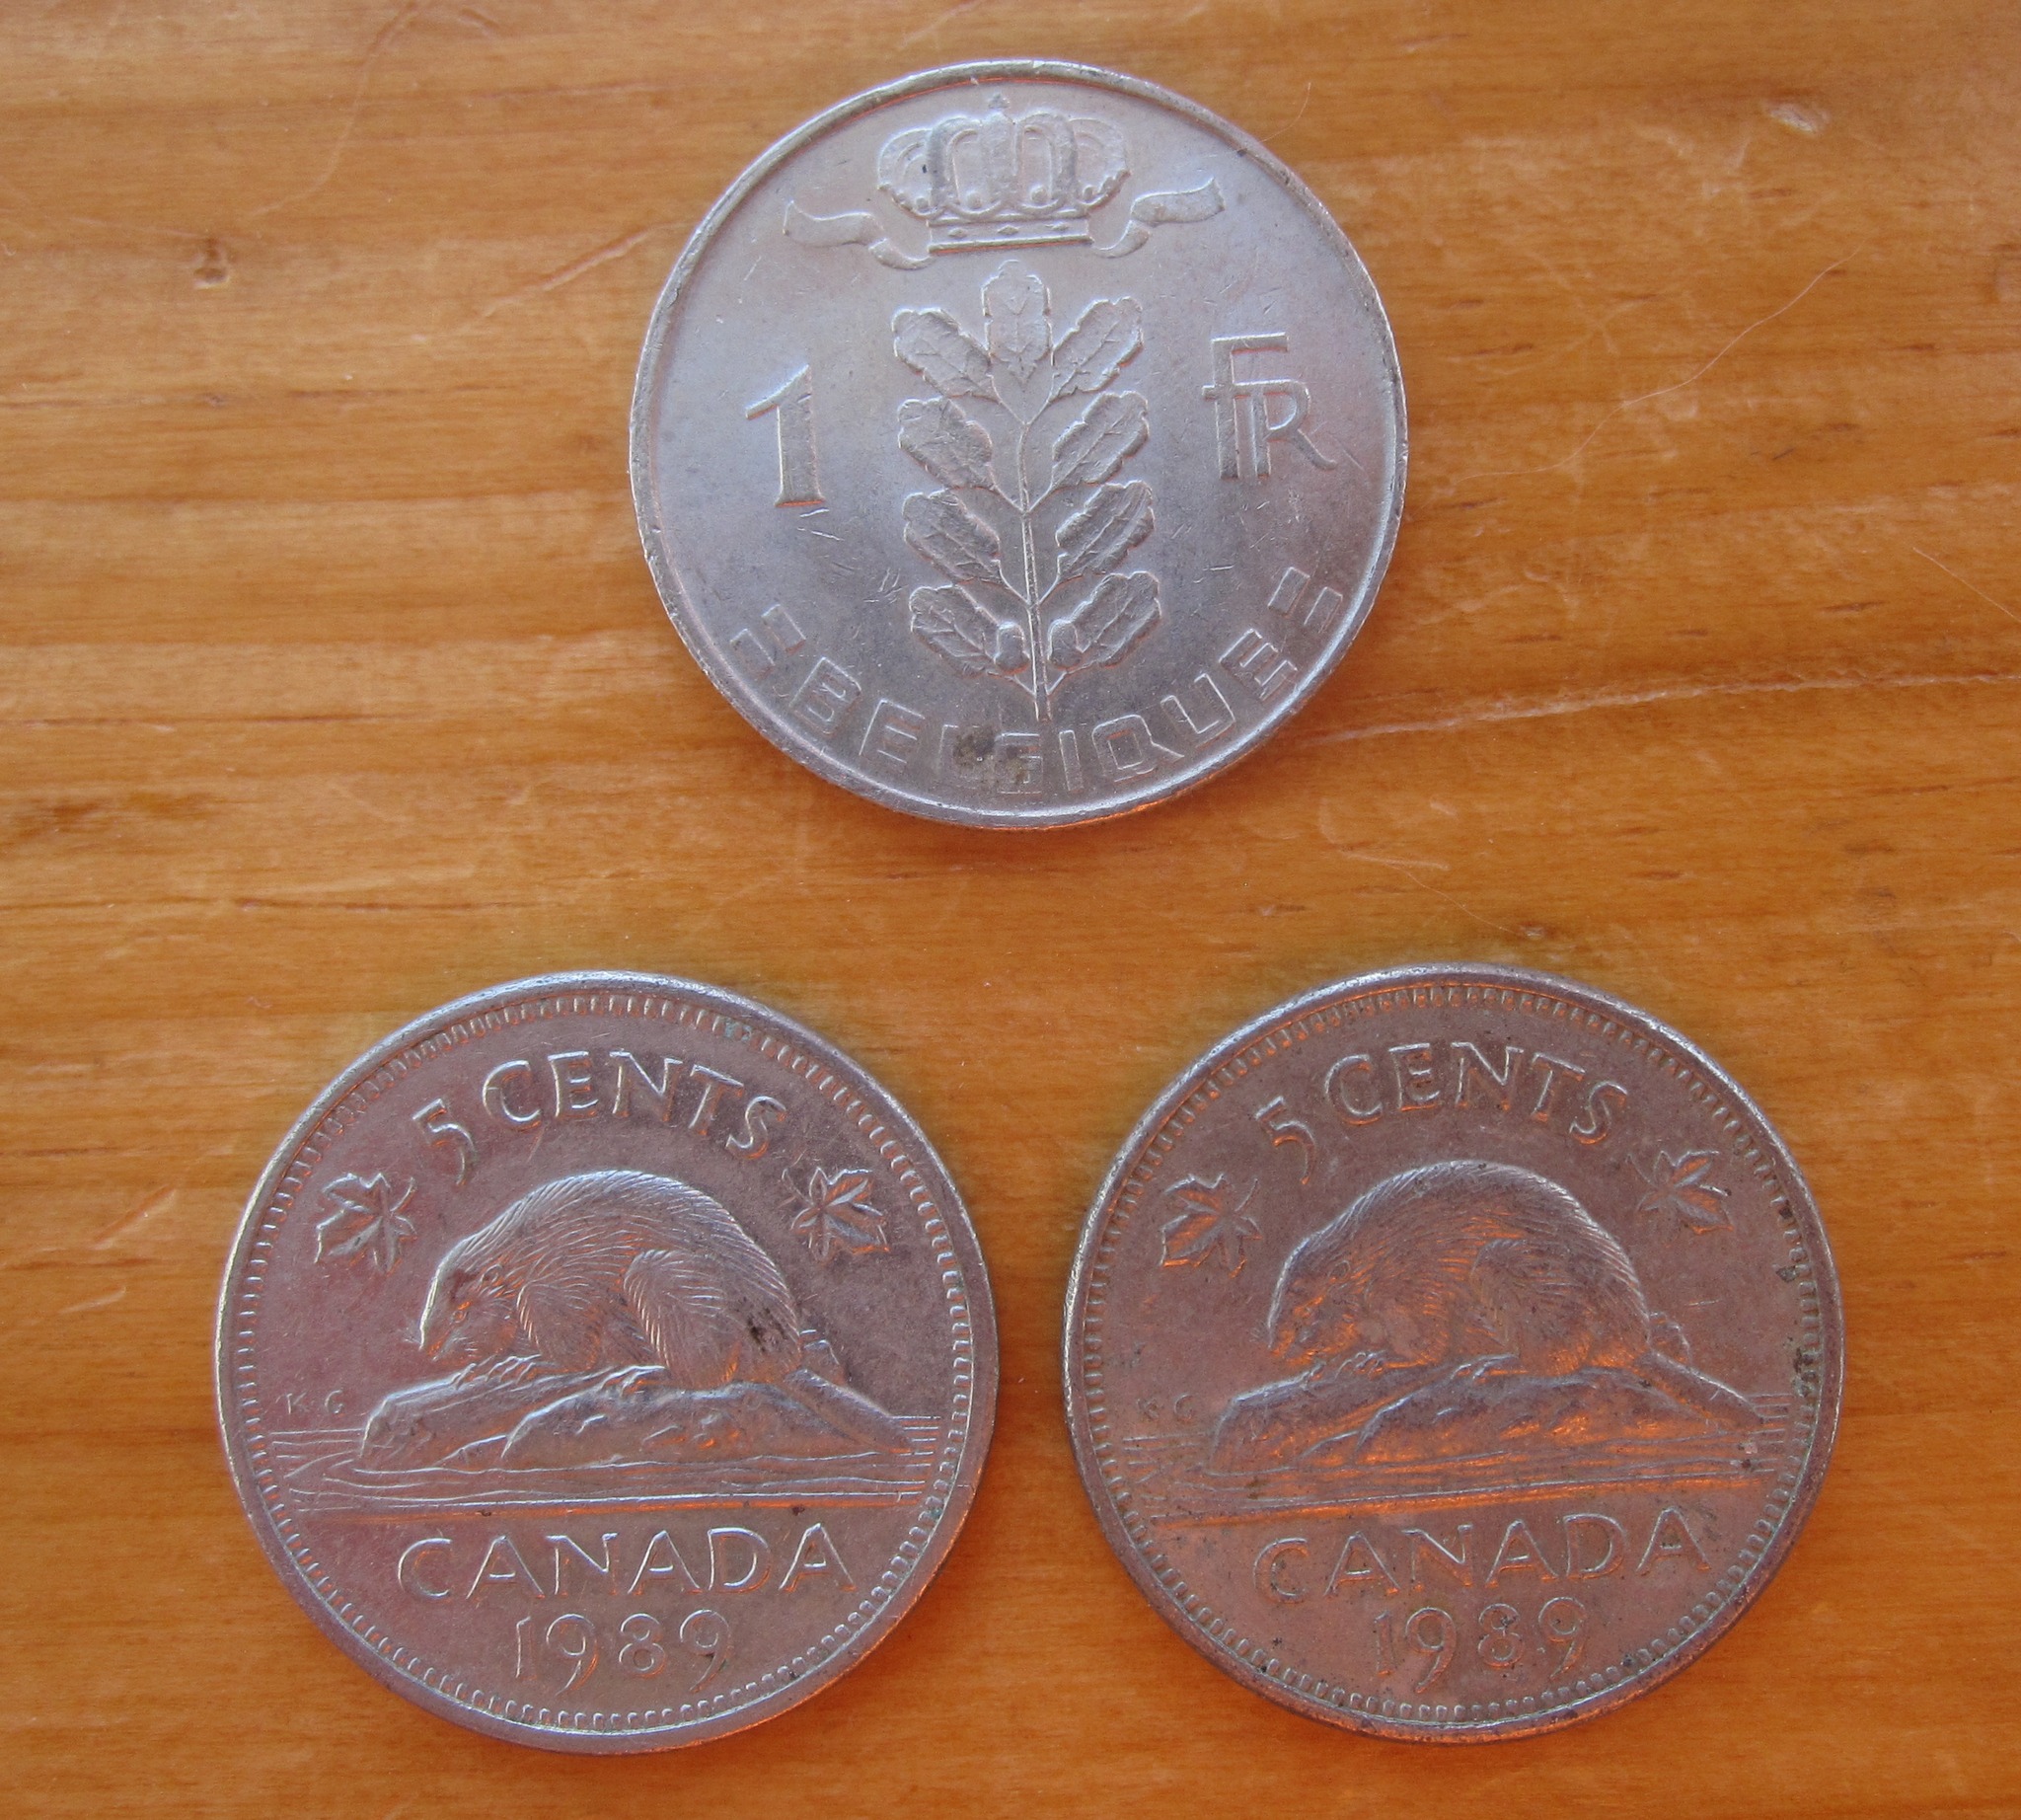
| 49 | 2 | Belgium | |||||||
| 50 | 3 | ||||||||
| 51 | 1 | 1 | 1 | 1 | |||||
| 52 | 1 | 1 | |||||||
| 53 | 1 | ||||||||
| 54 | 2 | ||||||||
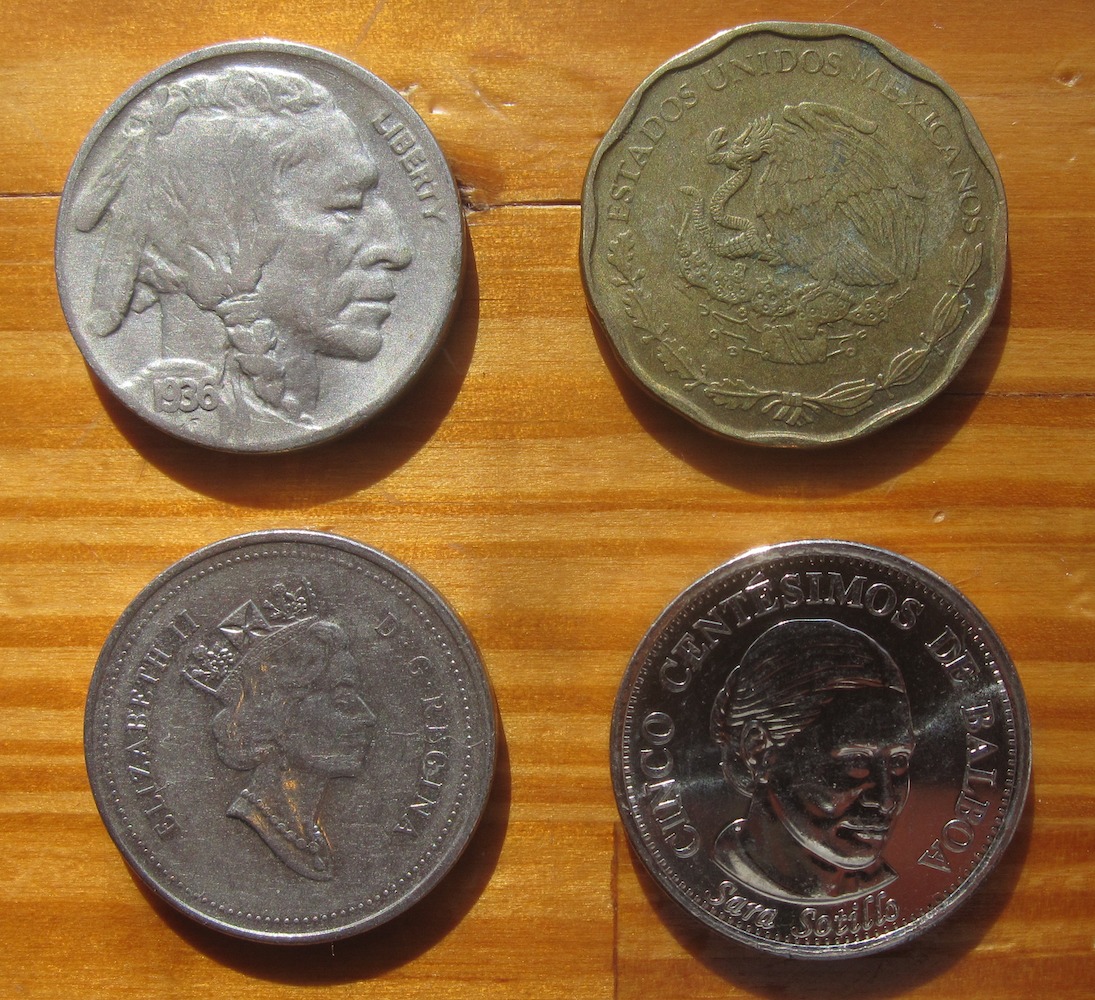
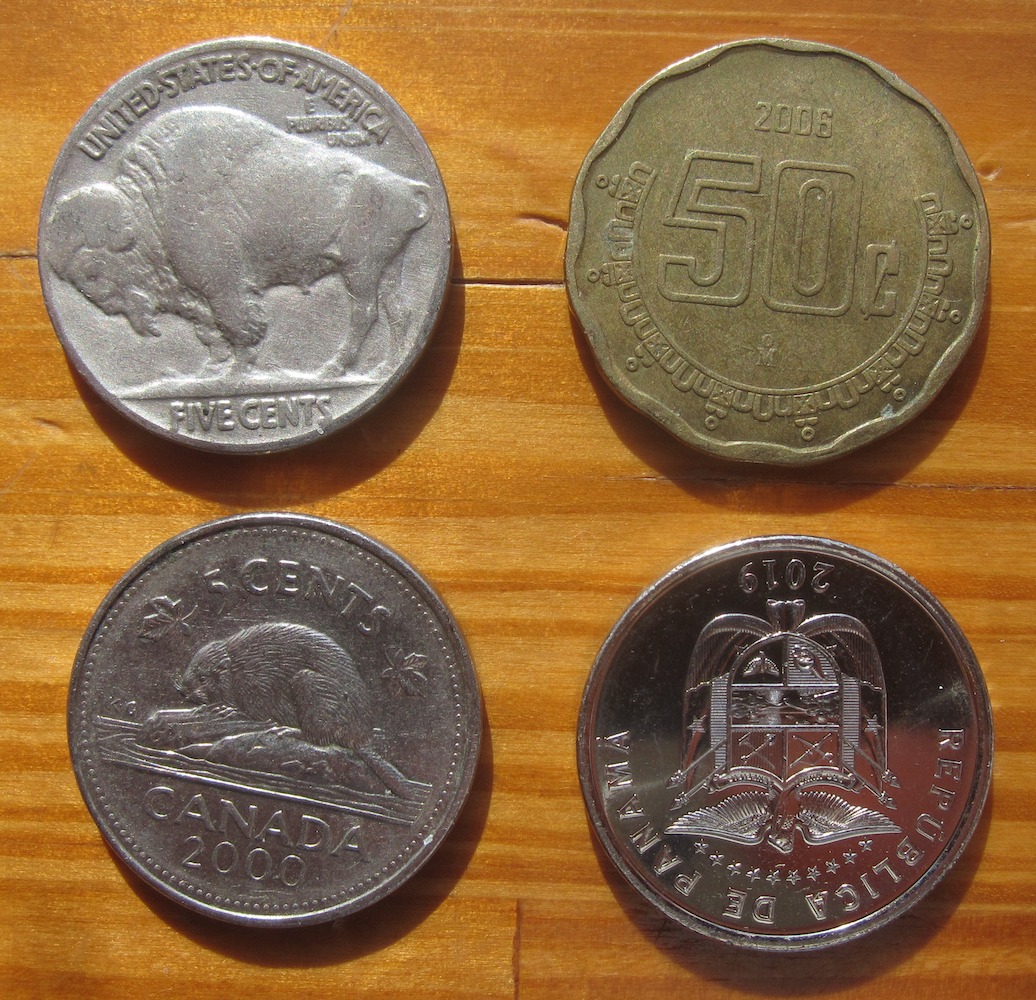
| 55 | 1 | 1 | Mexico, Panama | ||||||
| 56 | 1 | 1 | 2 | ||||||
| 57 | 1 | 1 | |||||||
| 58 | 2 | 1 | |||||||
| 59 | 2 | ||||||||
| 60 | 1 | 2 | |||||||
| 60 | Totals: | 0 | 4 | 33 | 35 | 12 | 37 | 6 | |
| Per Box | 0.00000 | 0.06667 | 0.55000 | 0.58333 | 0.20000 | 0.61667 | 0.10000 |
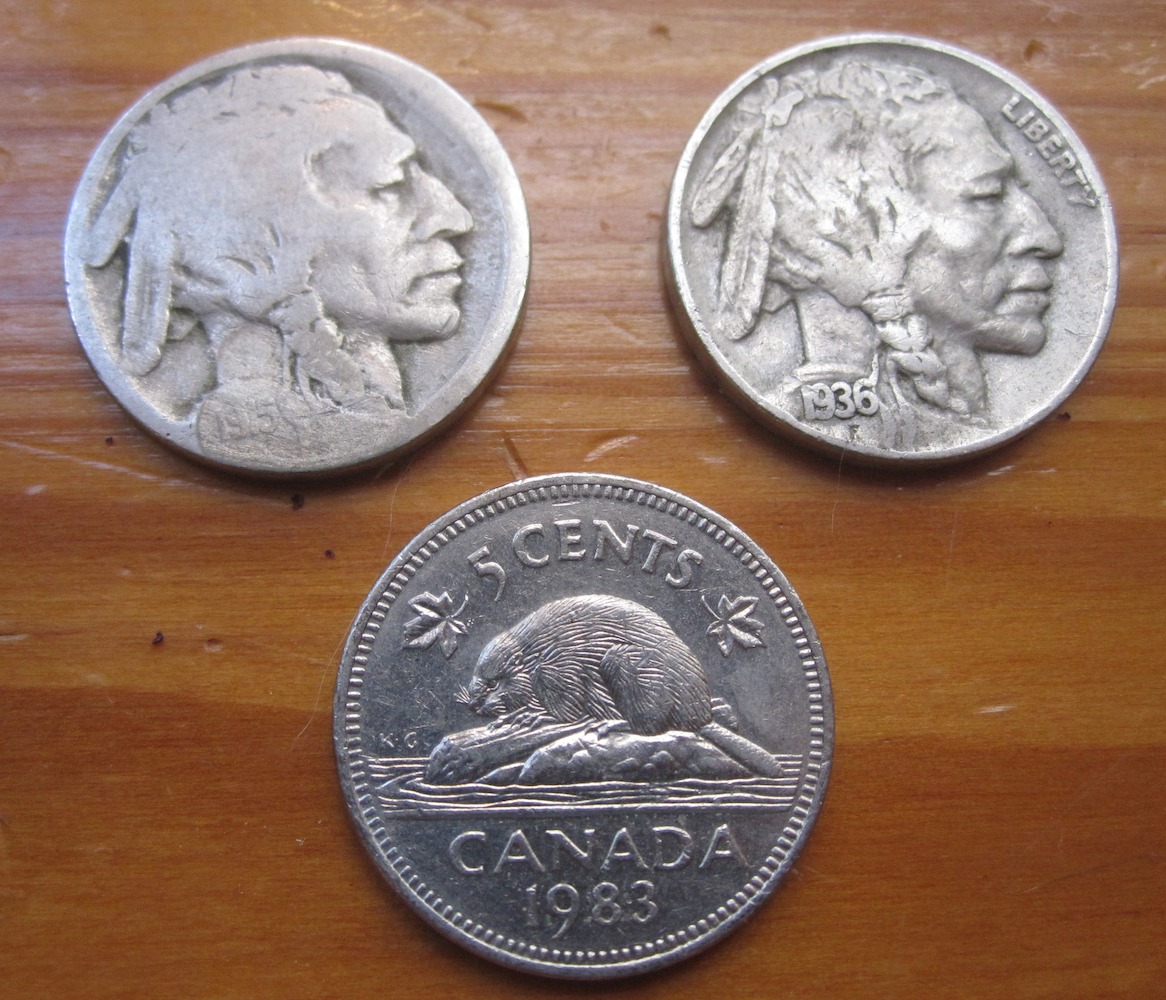
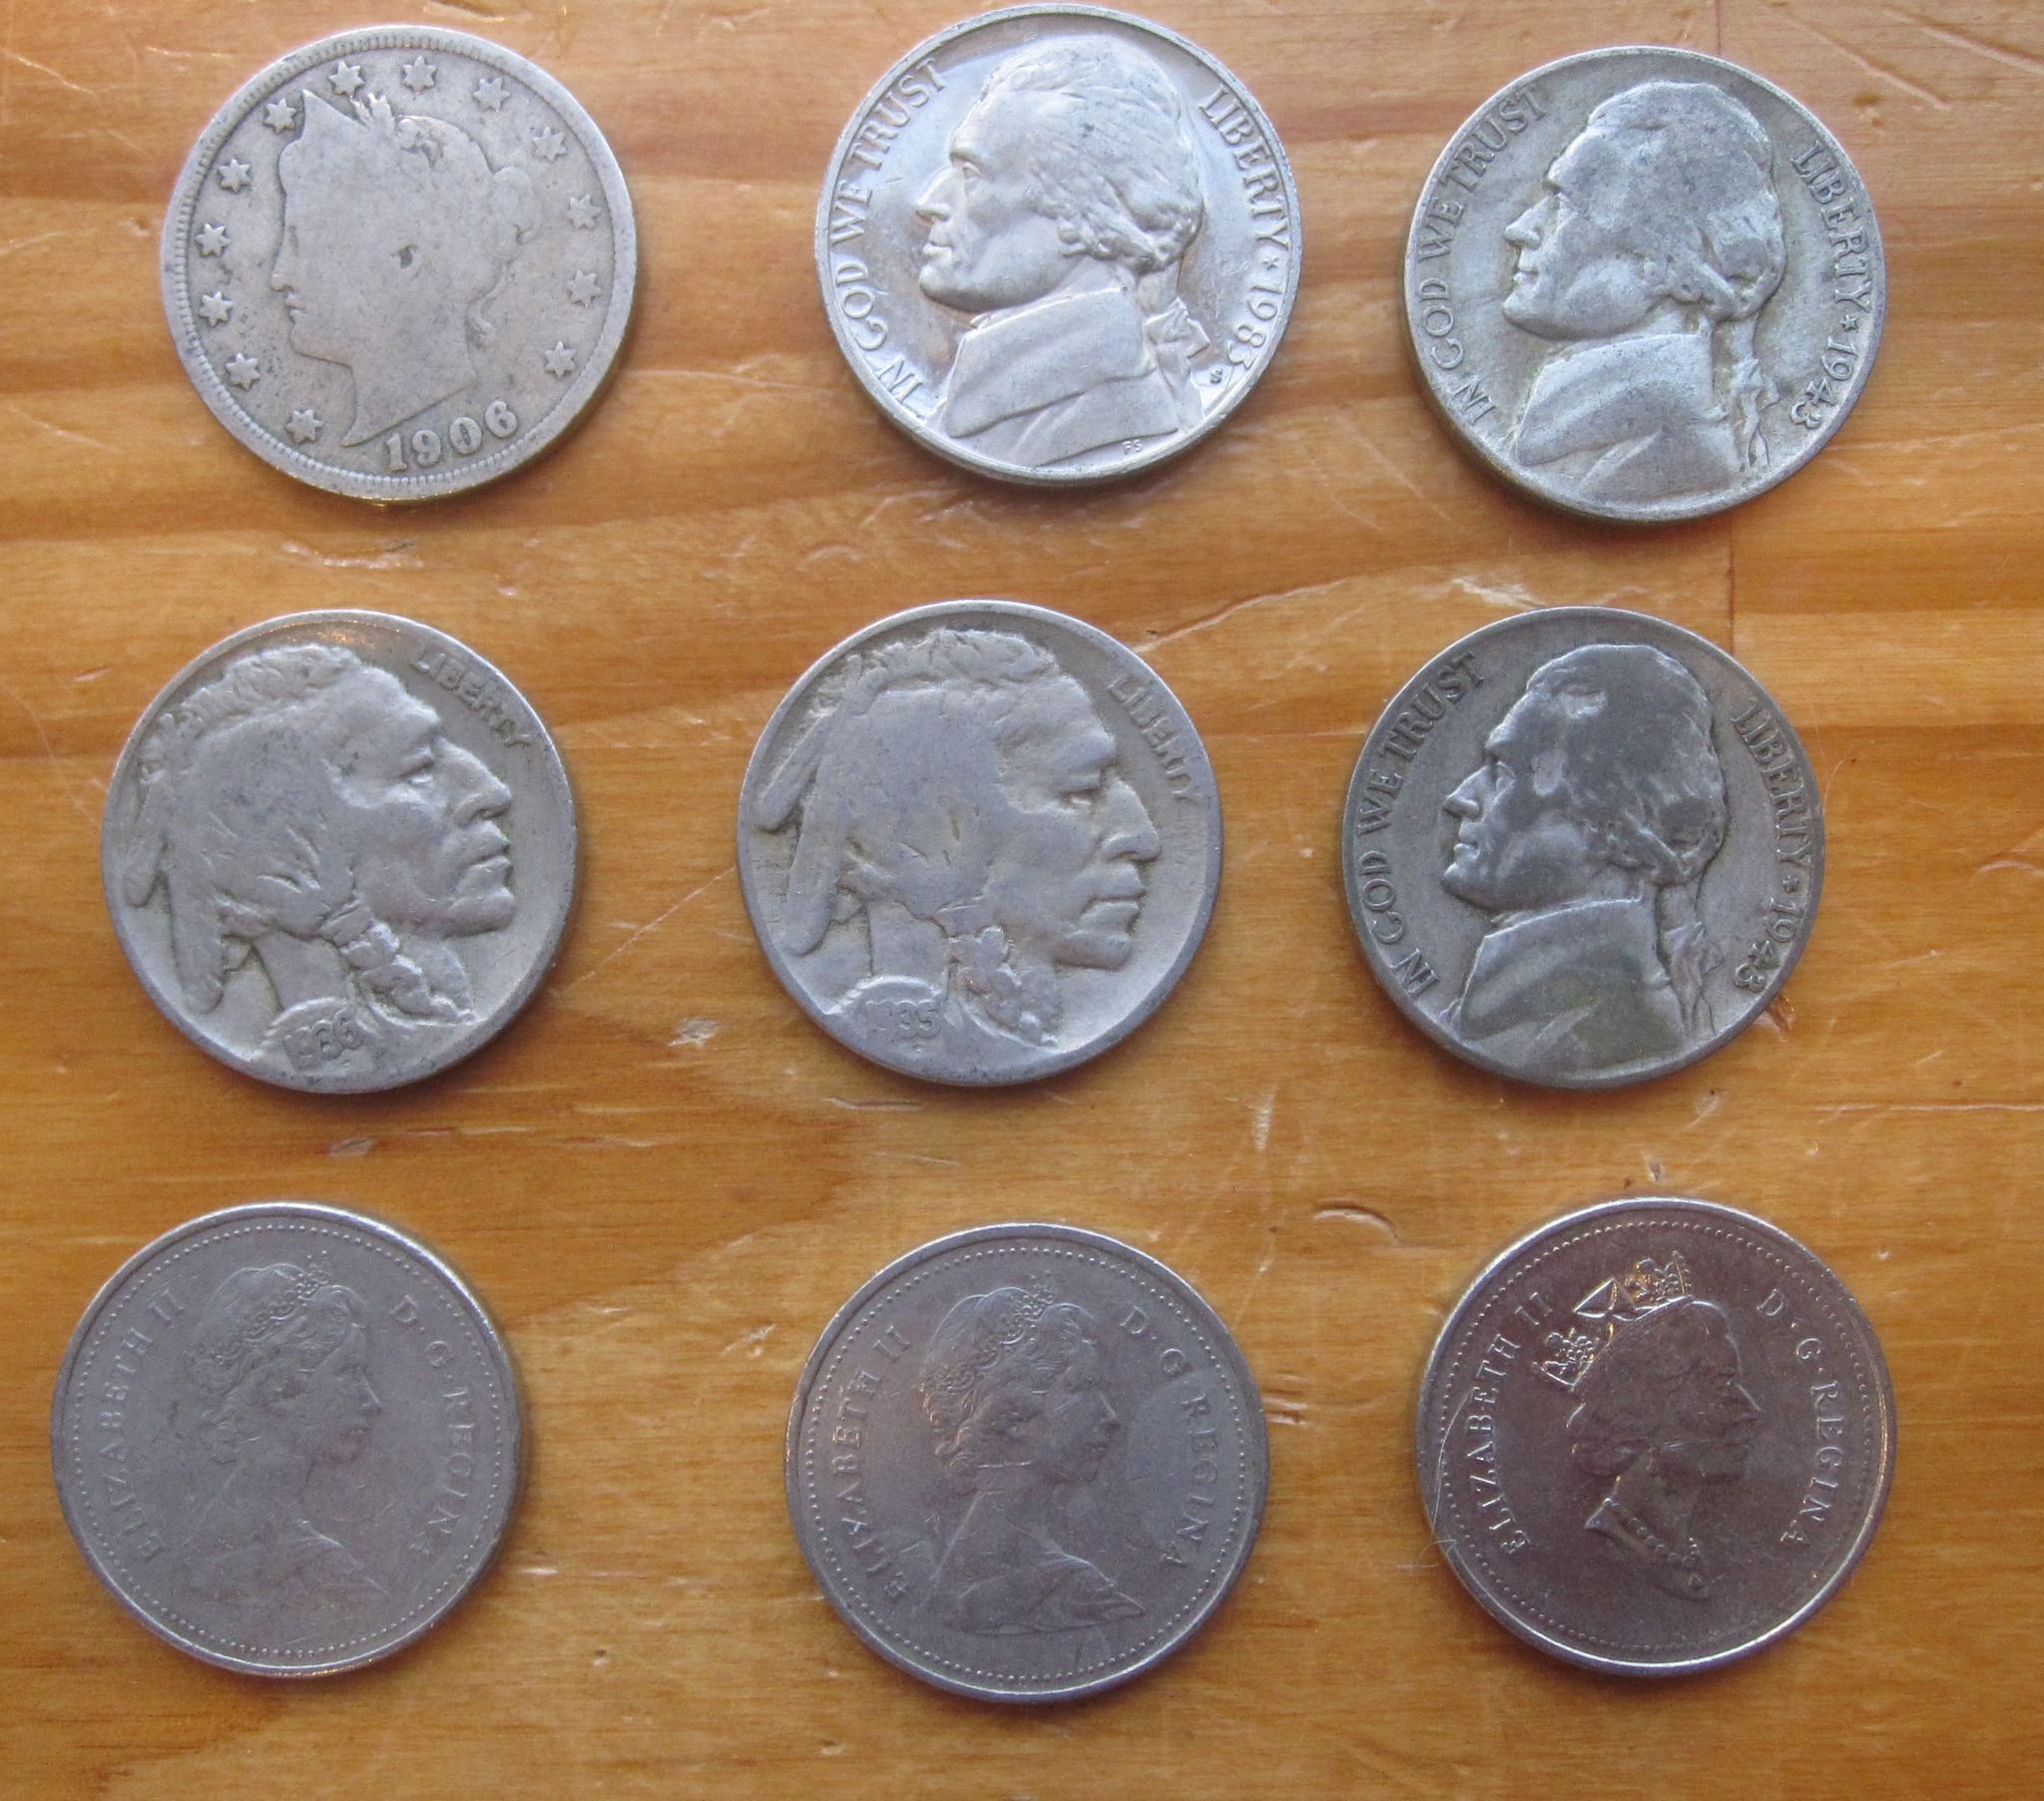
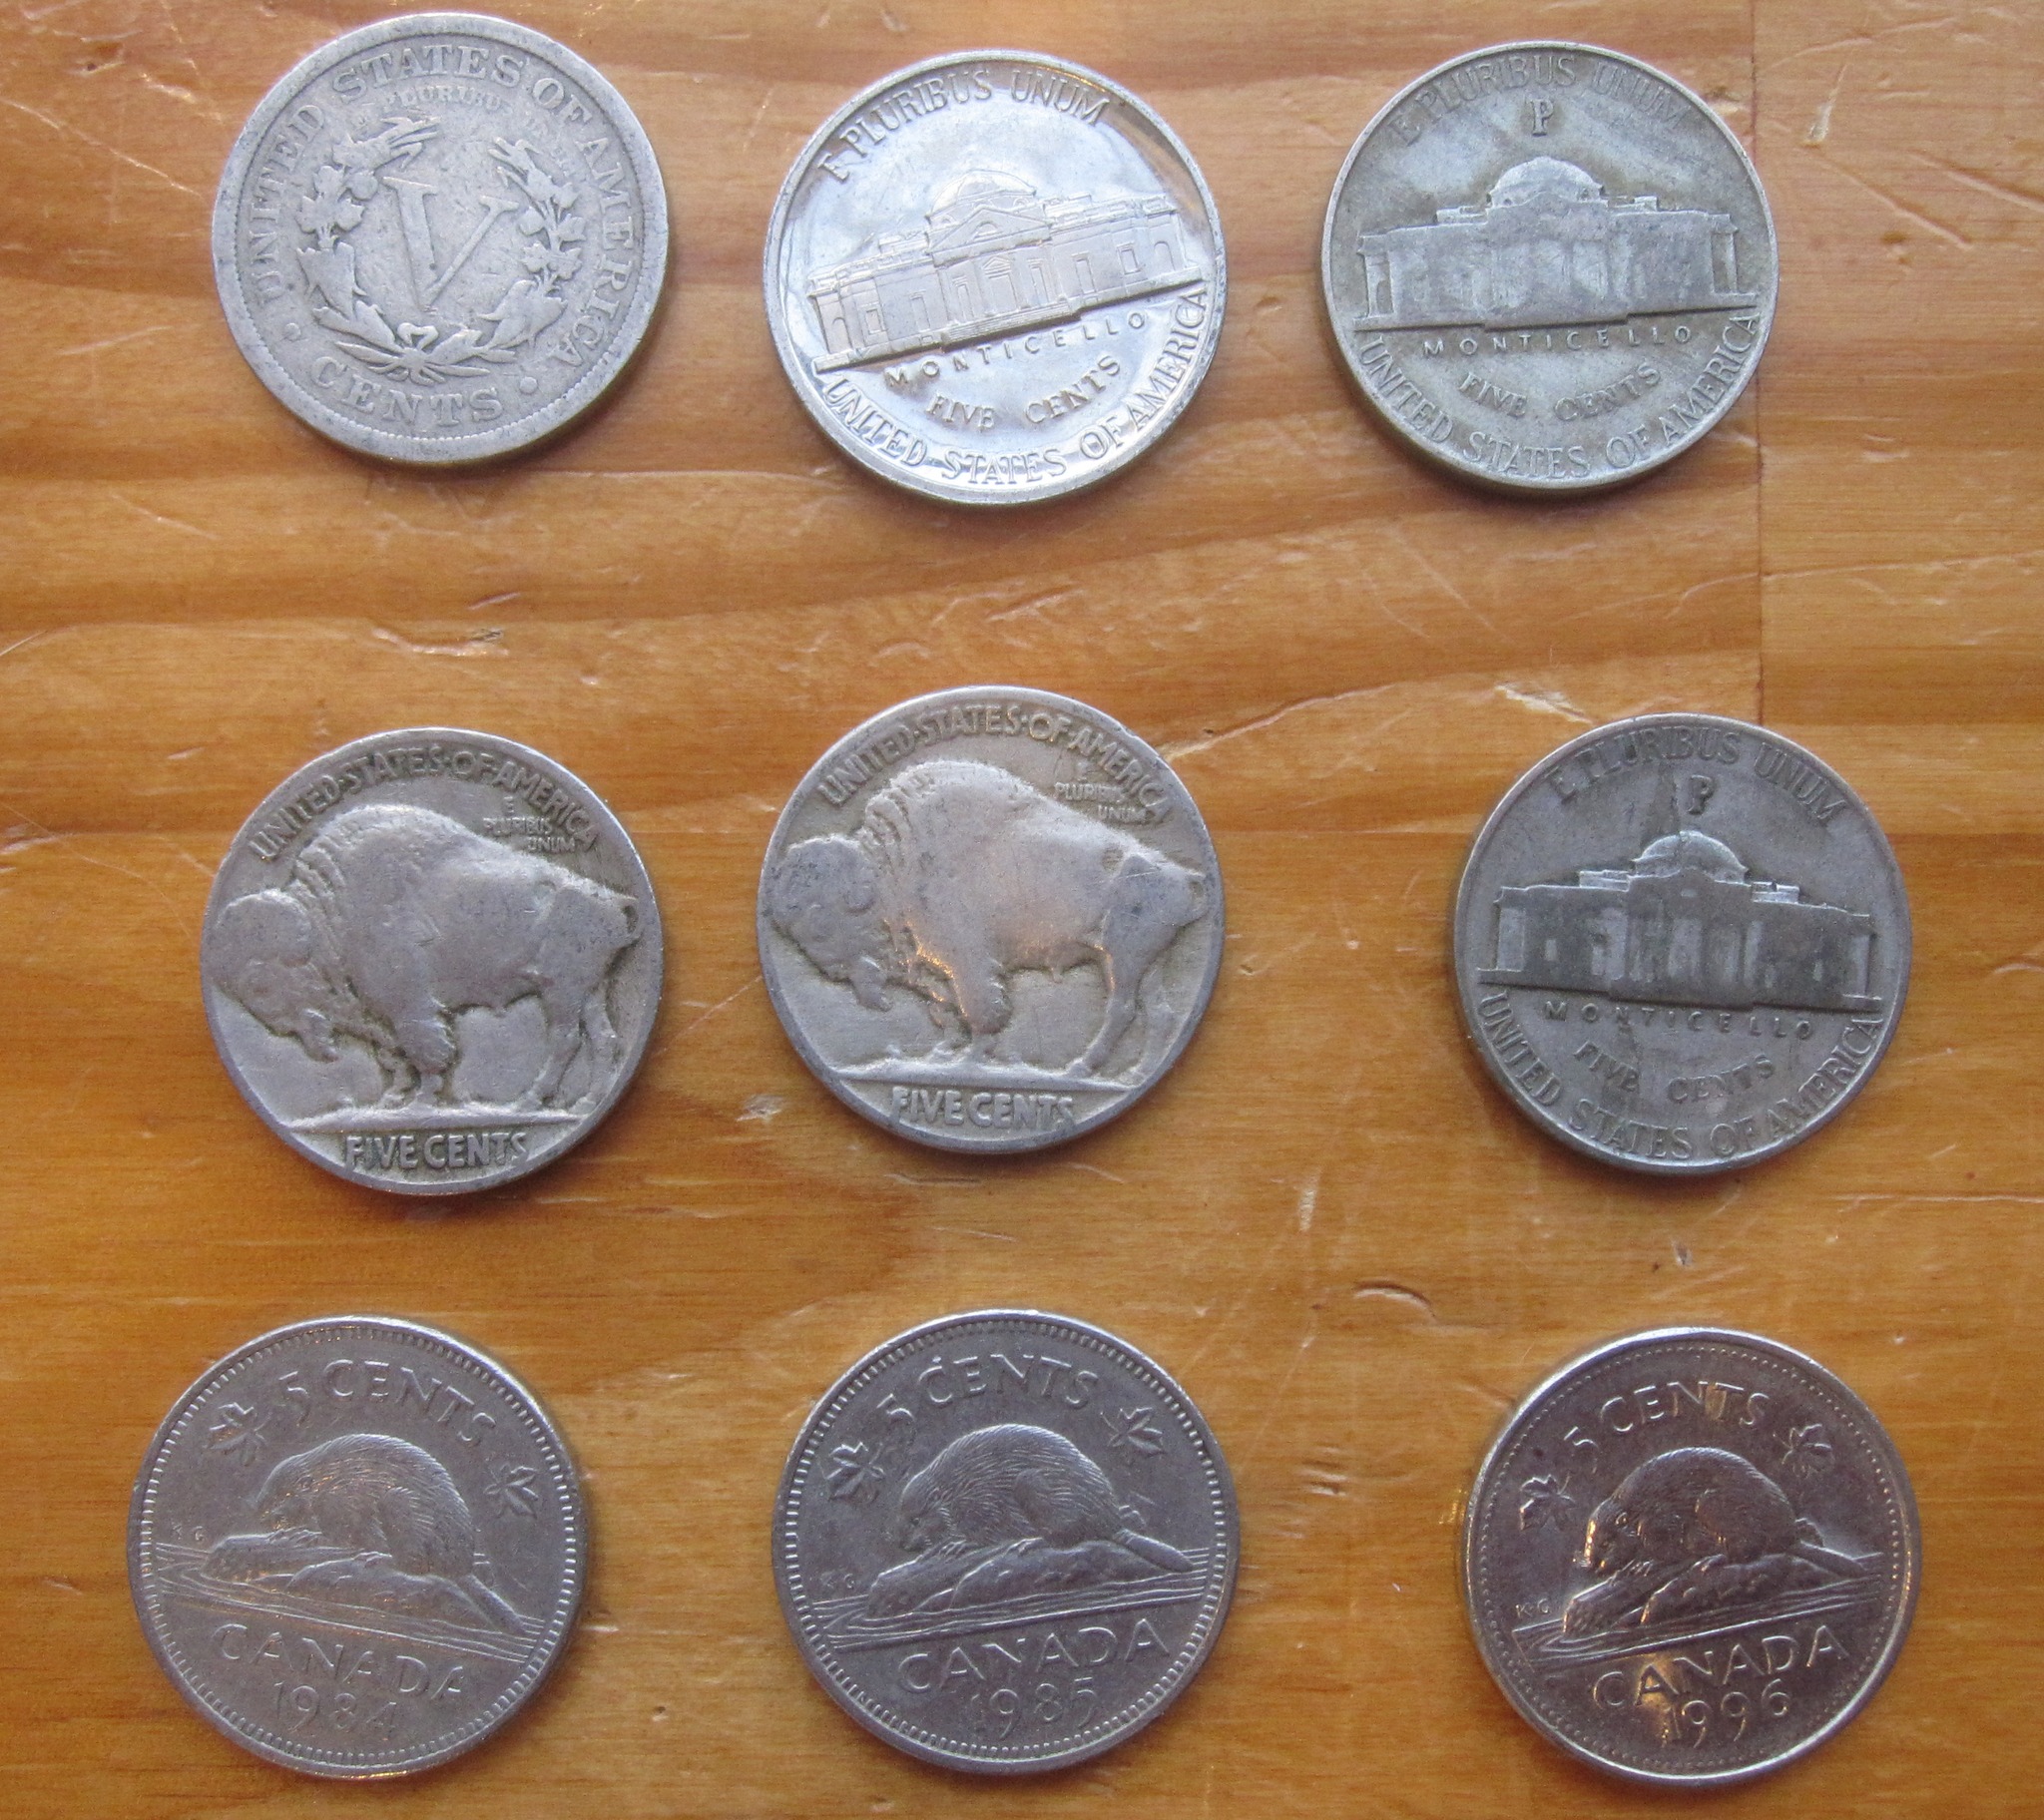
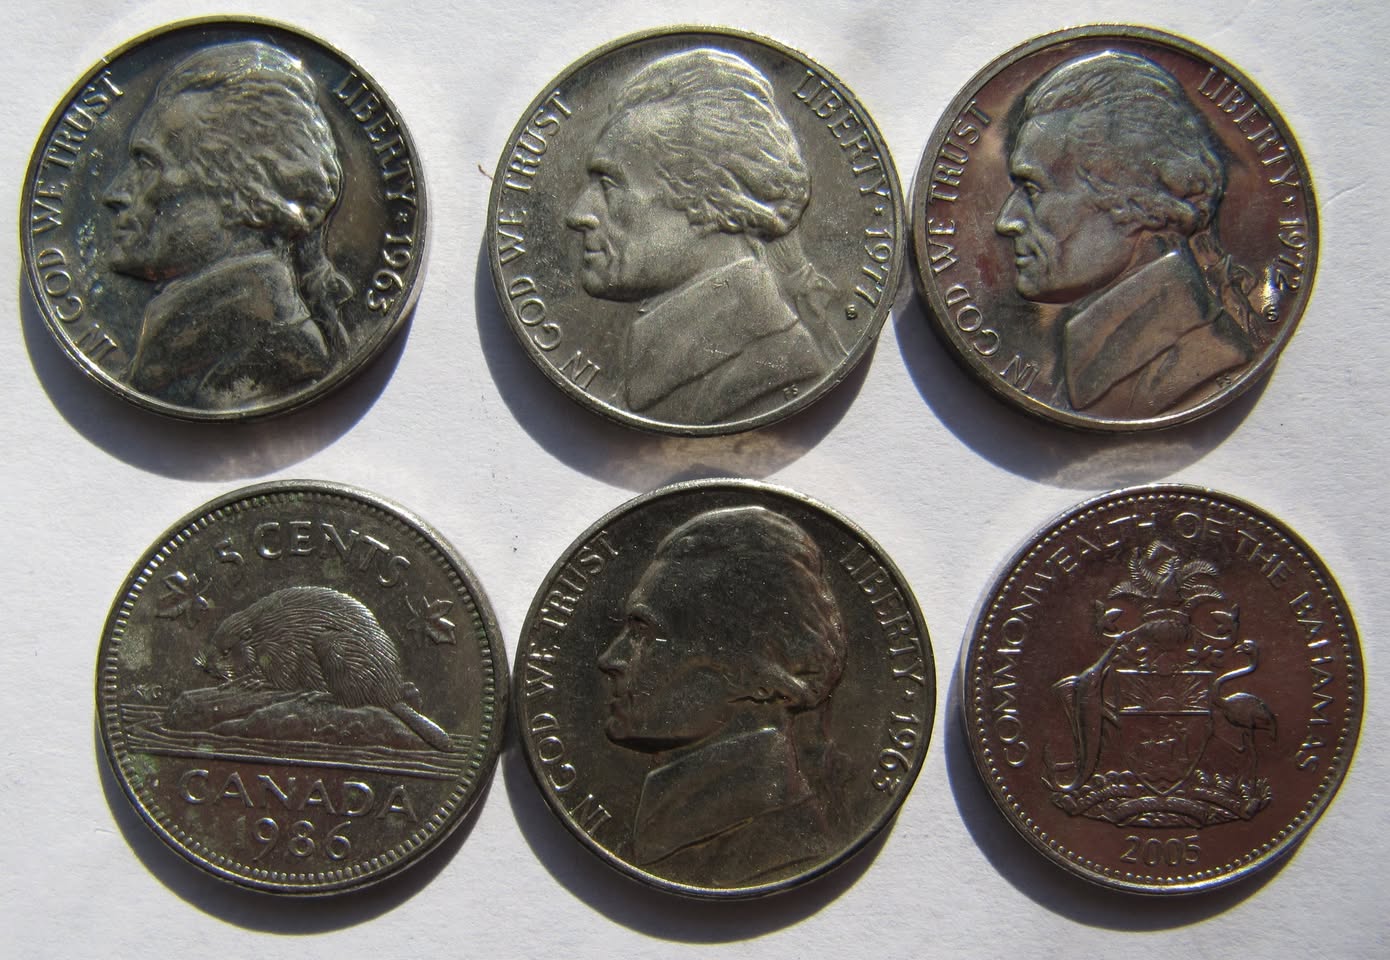
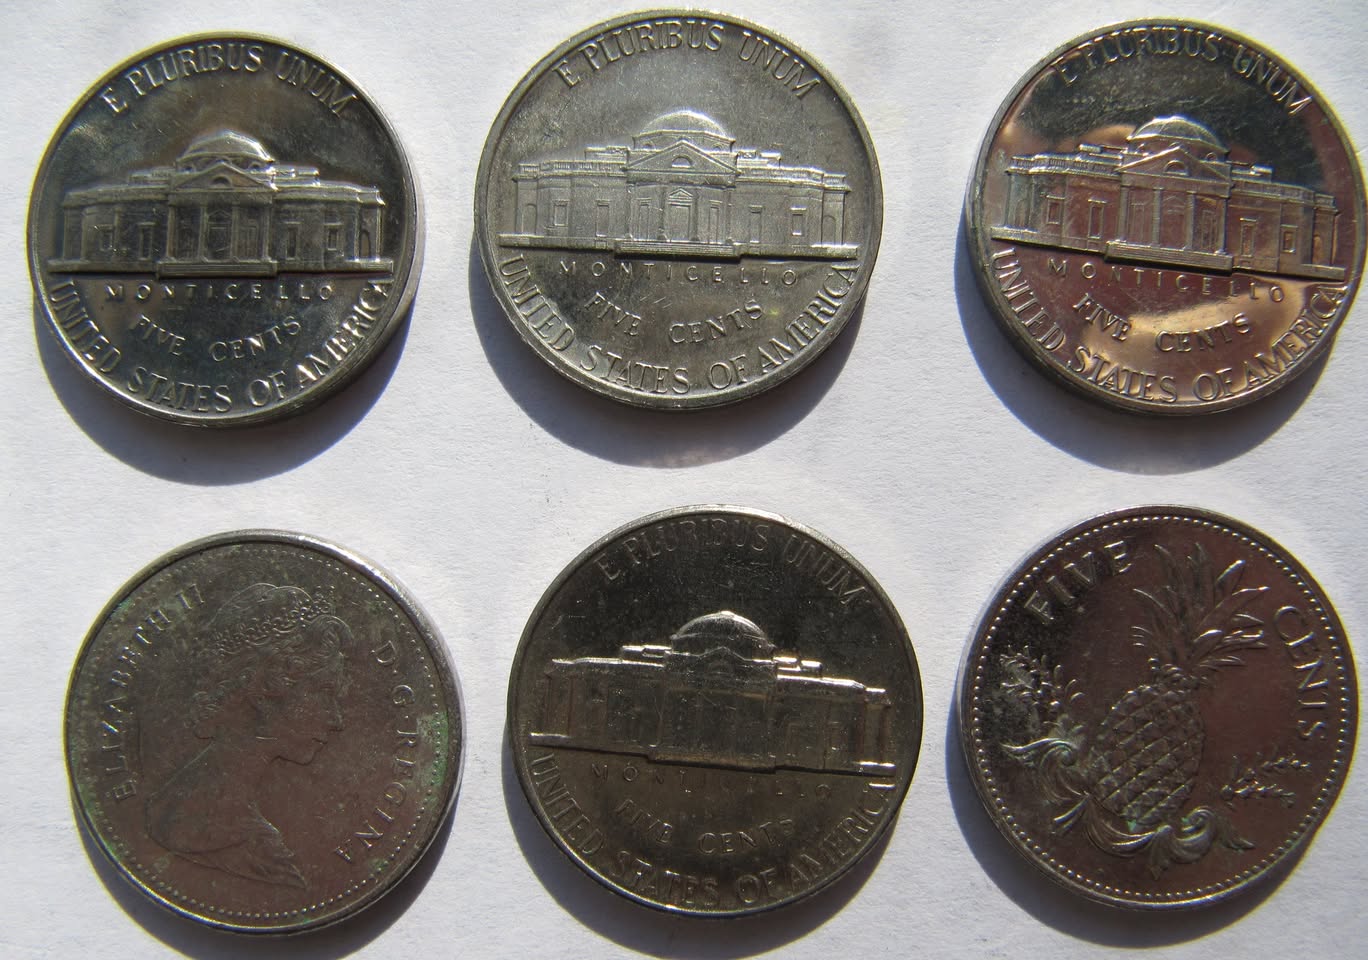
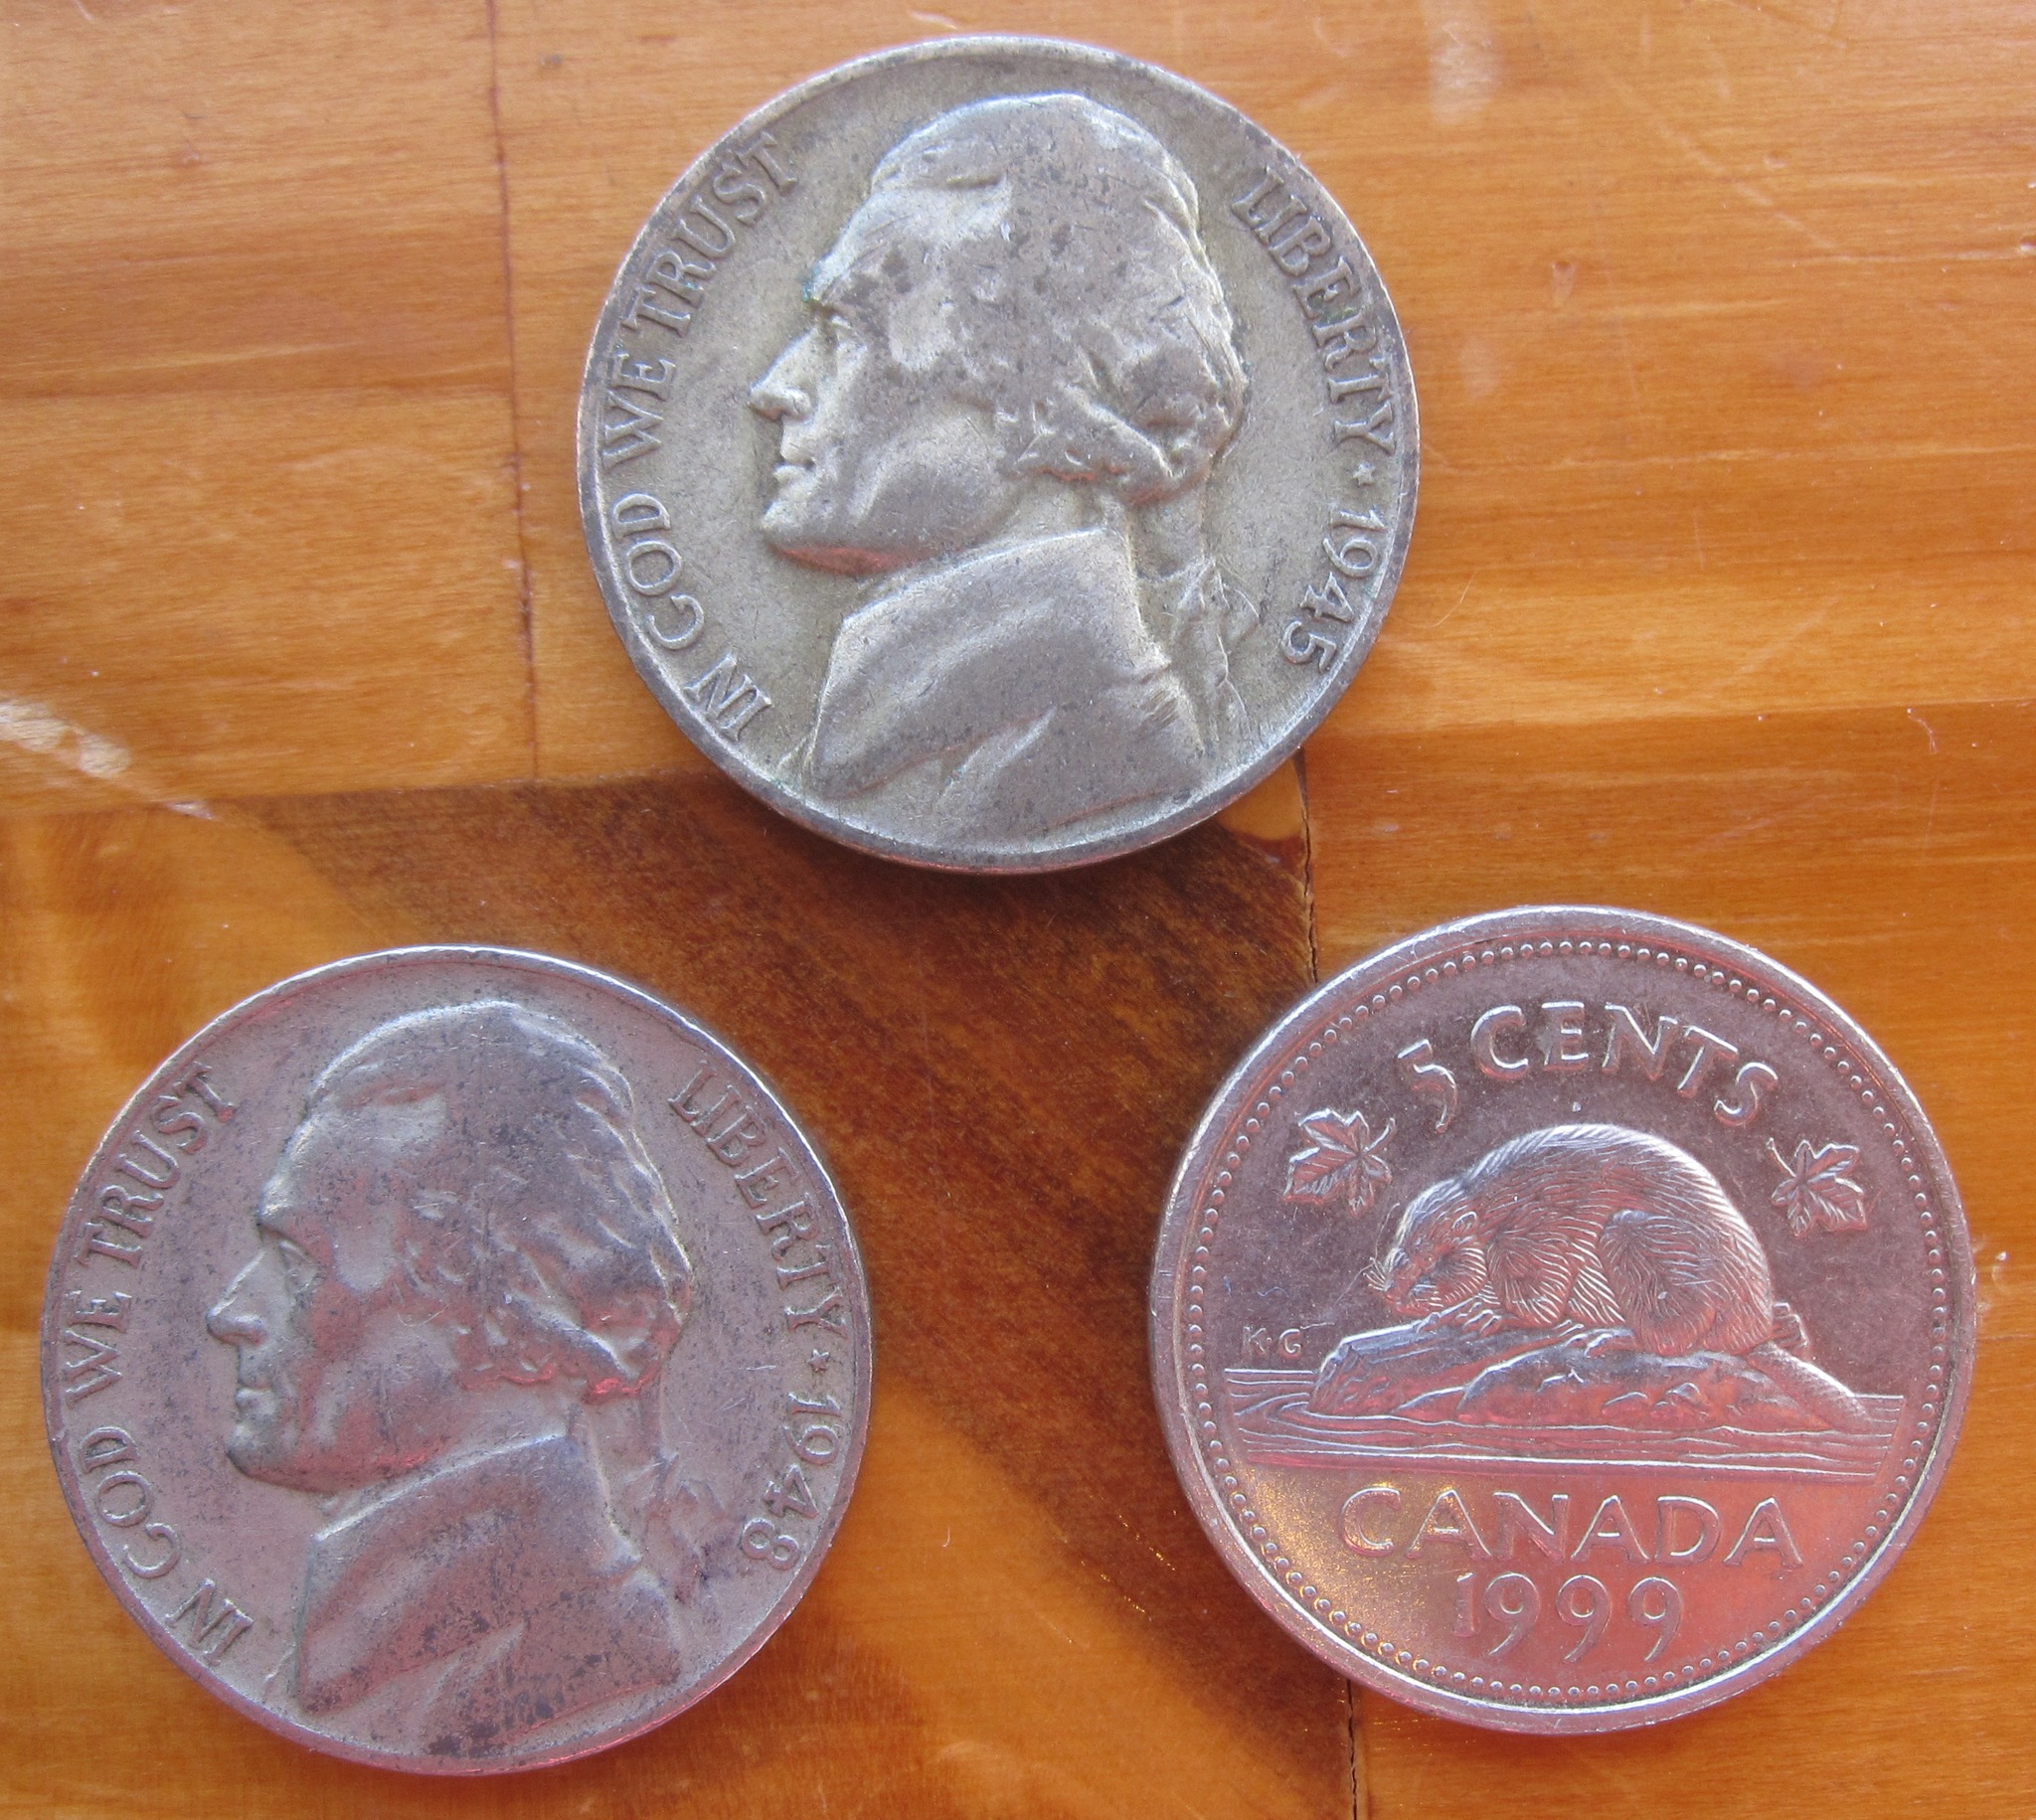
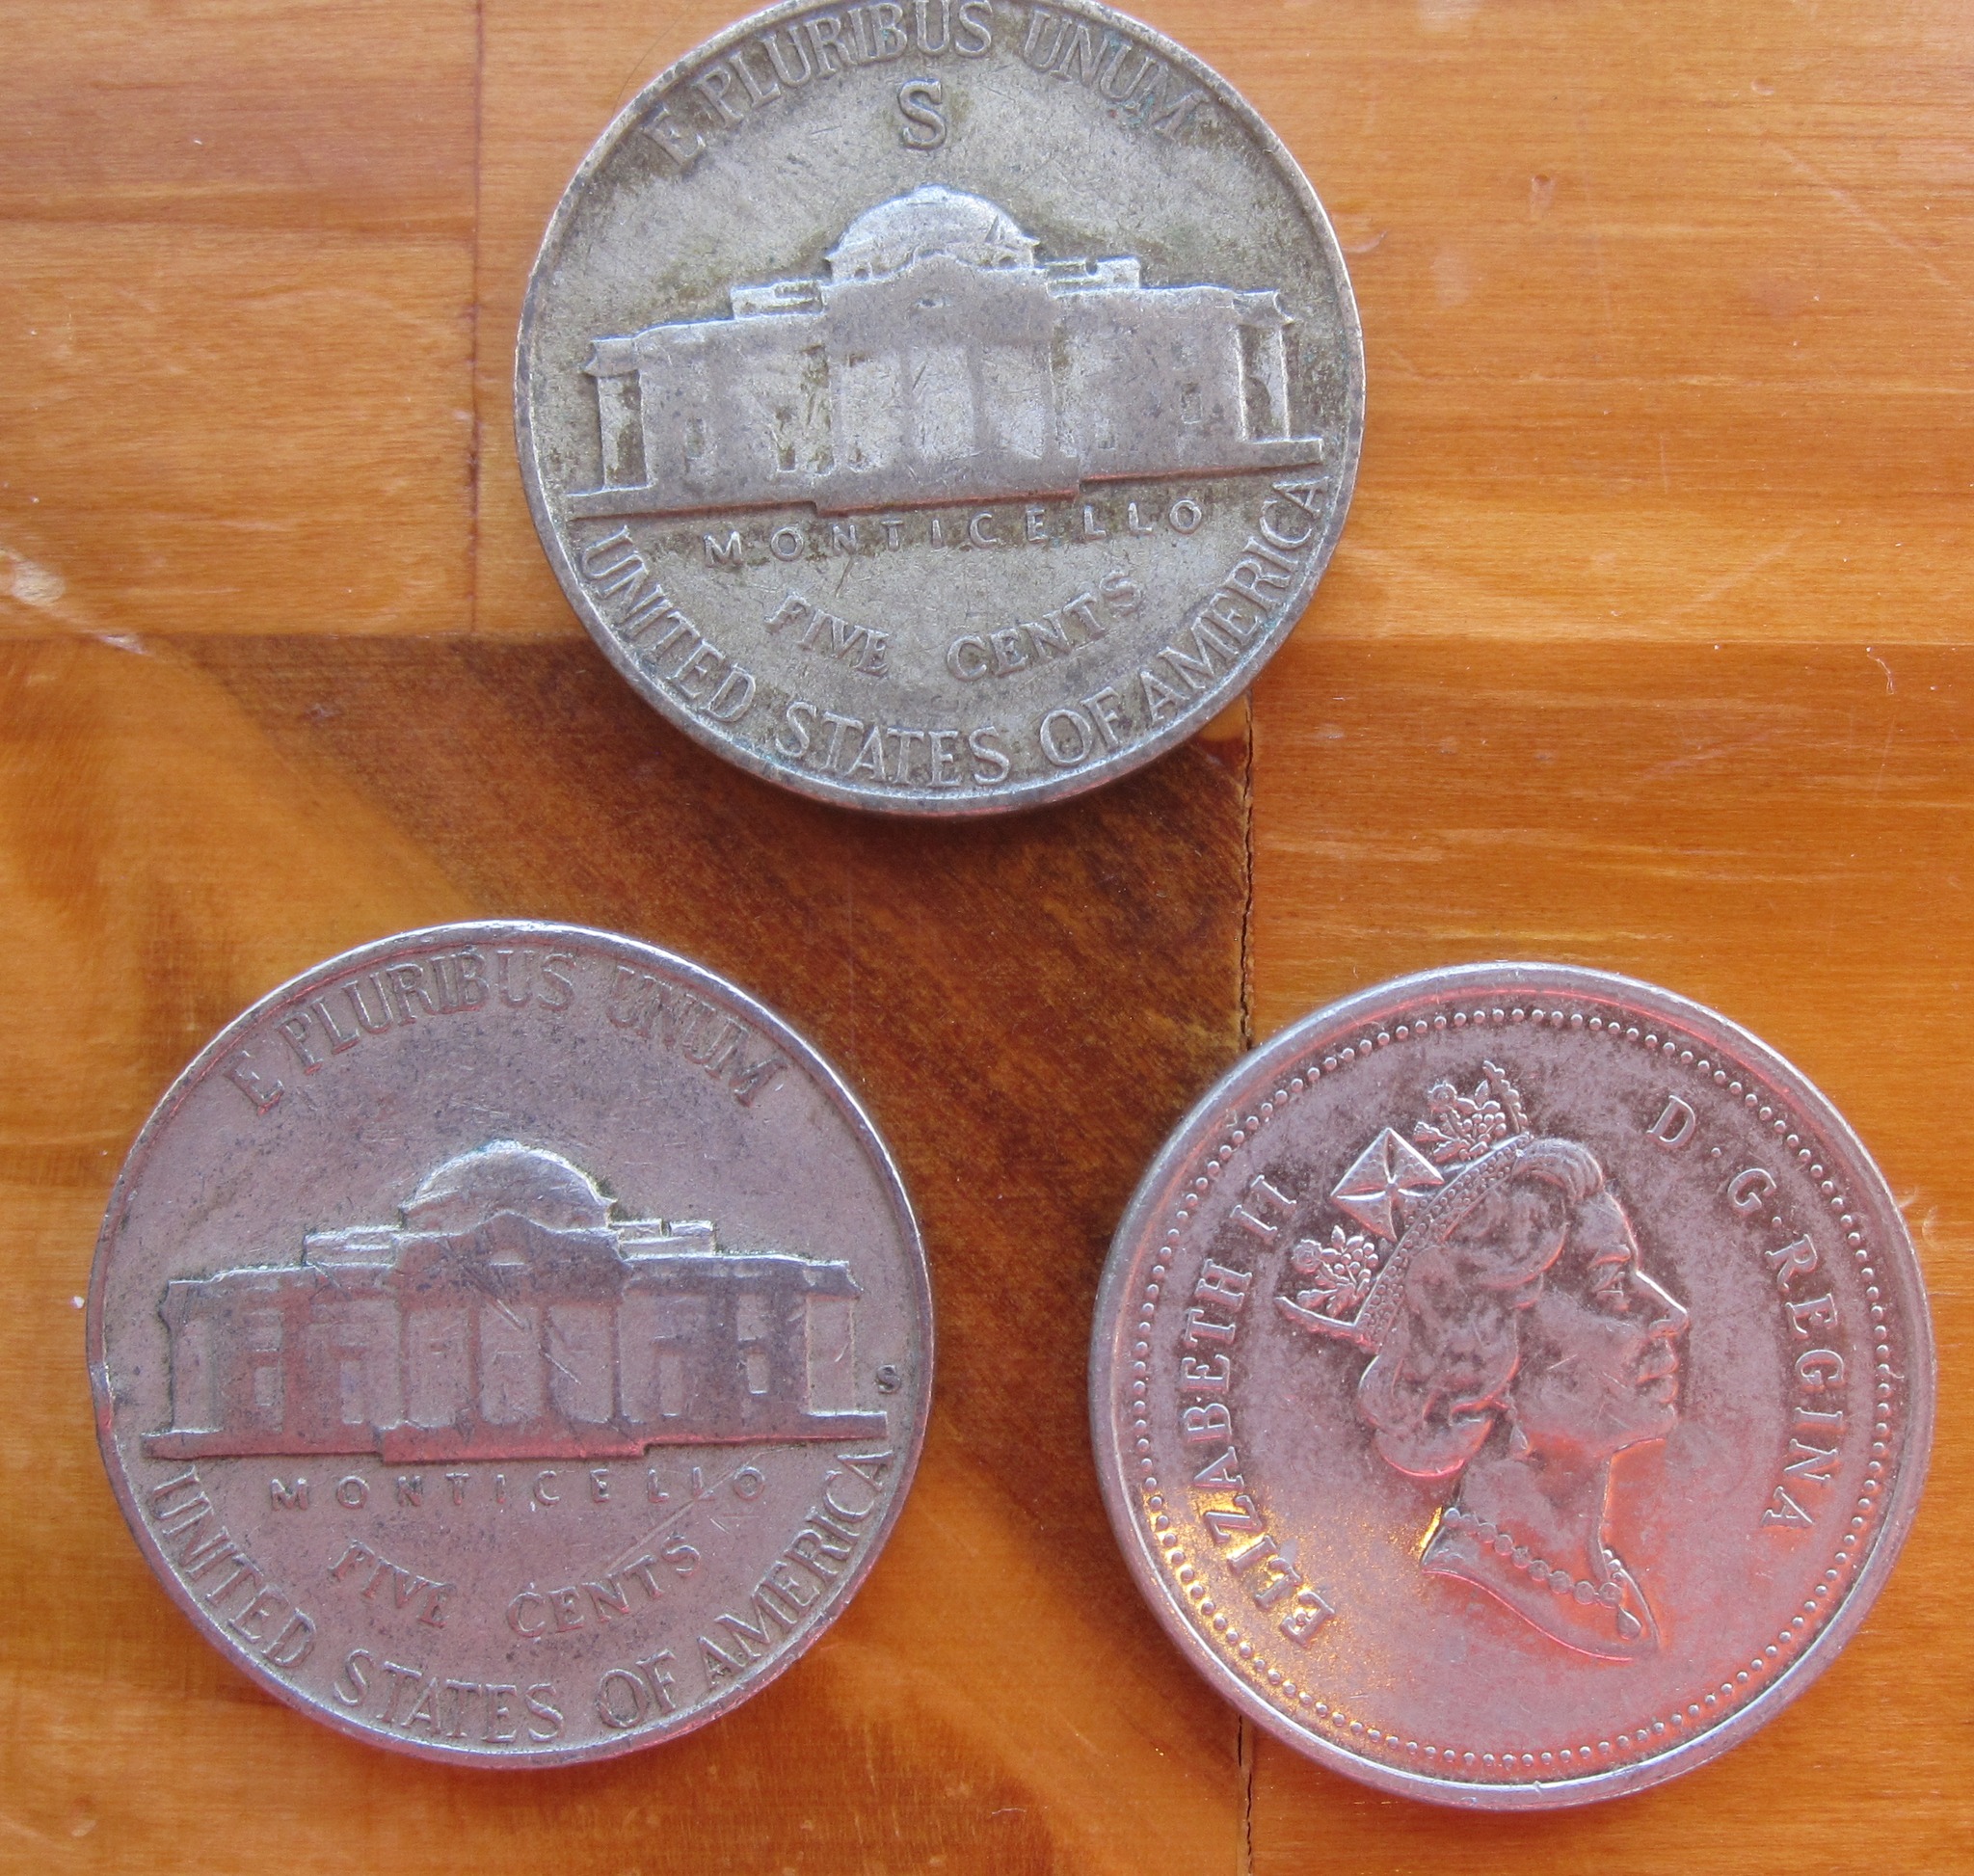
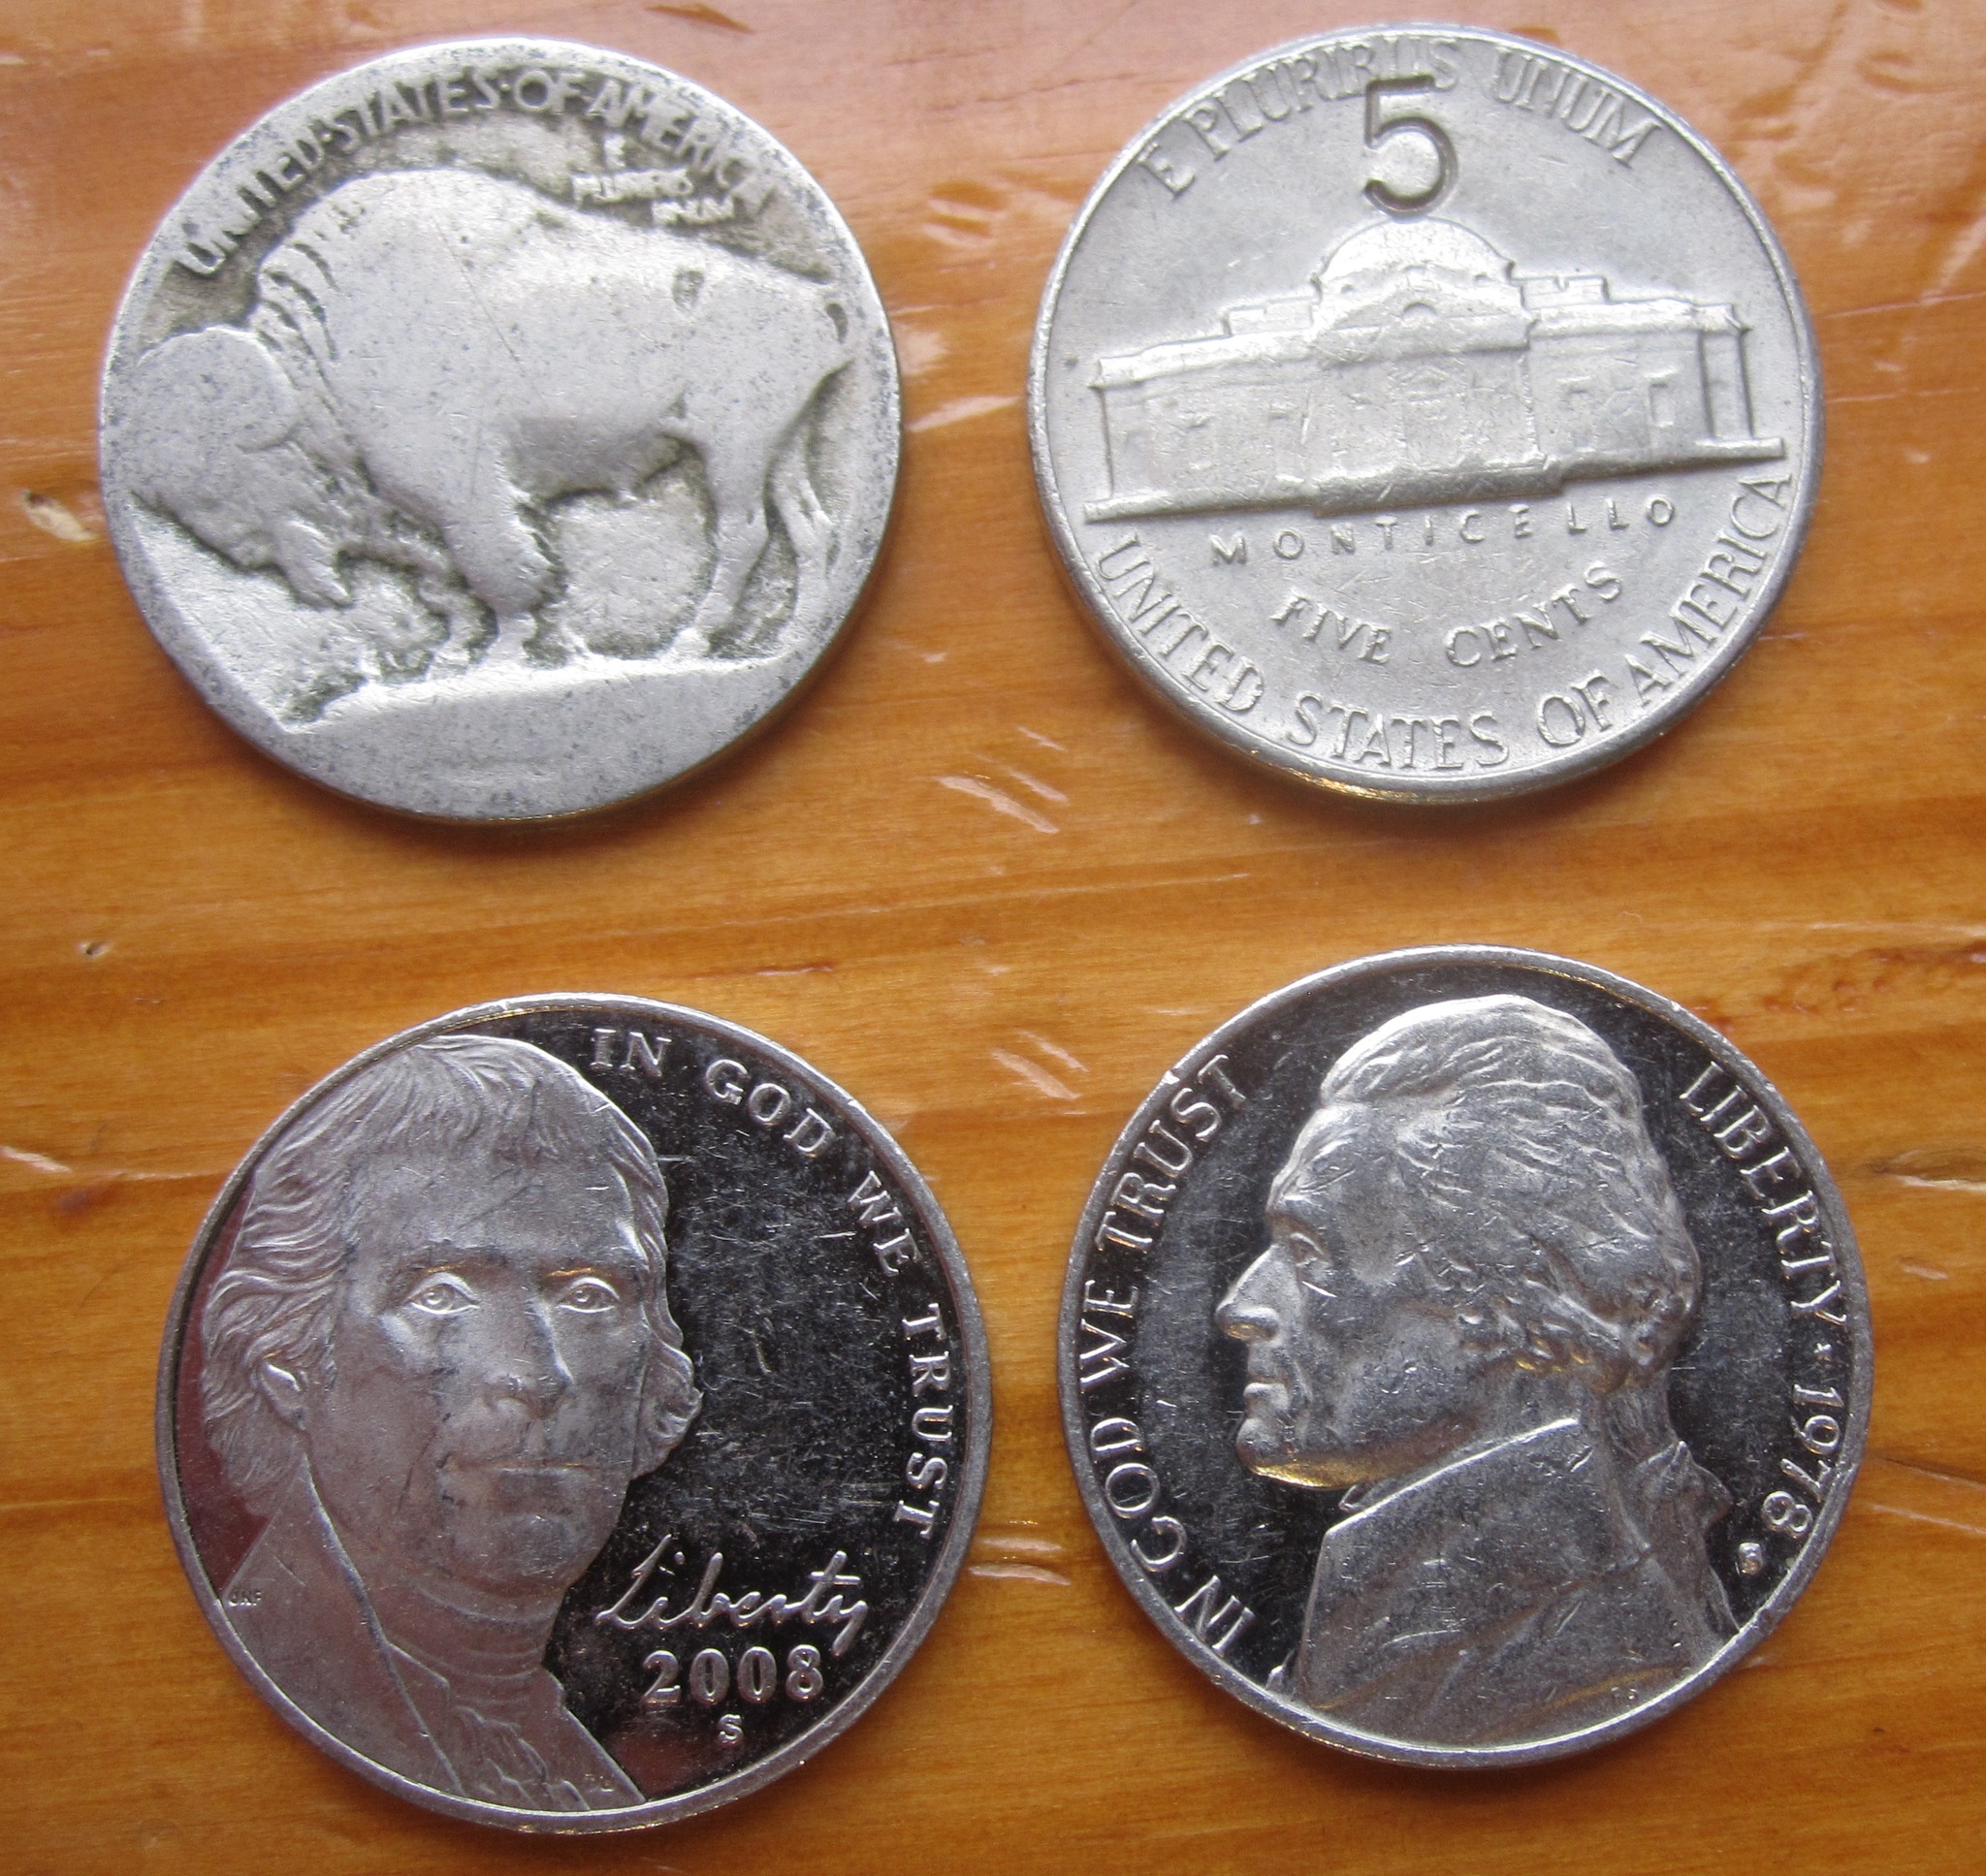
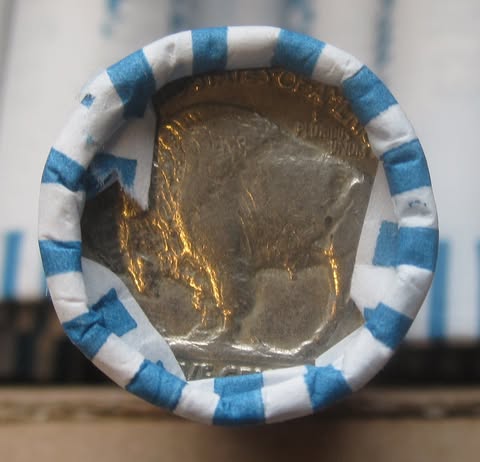
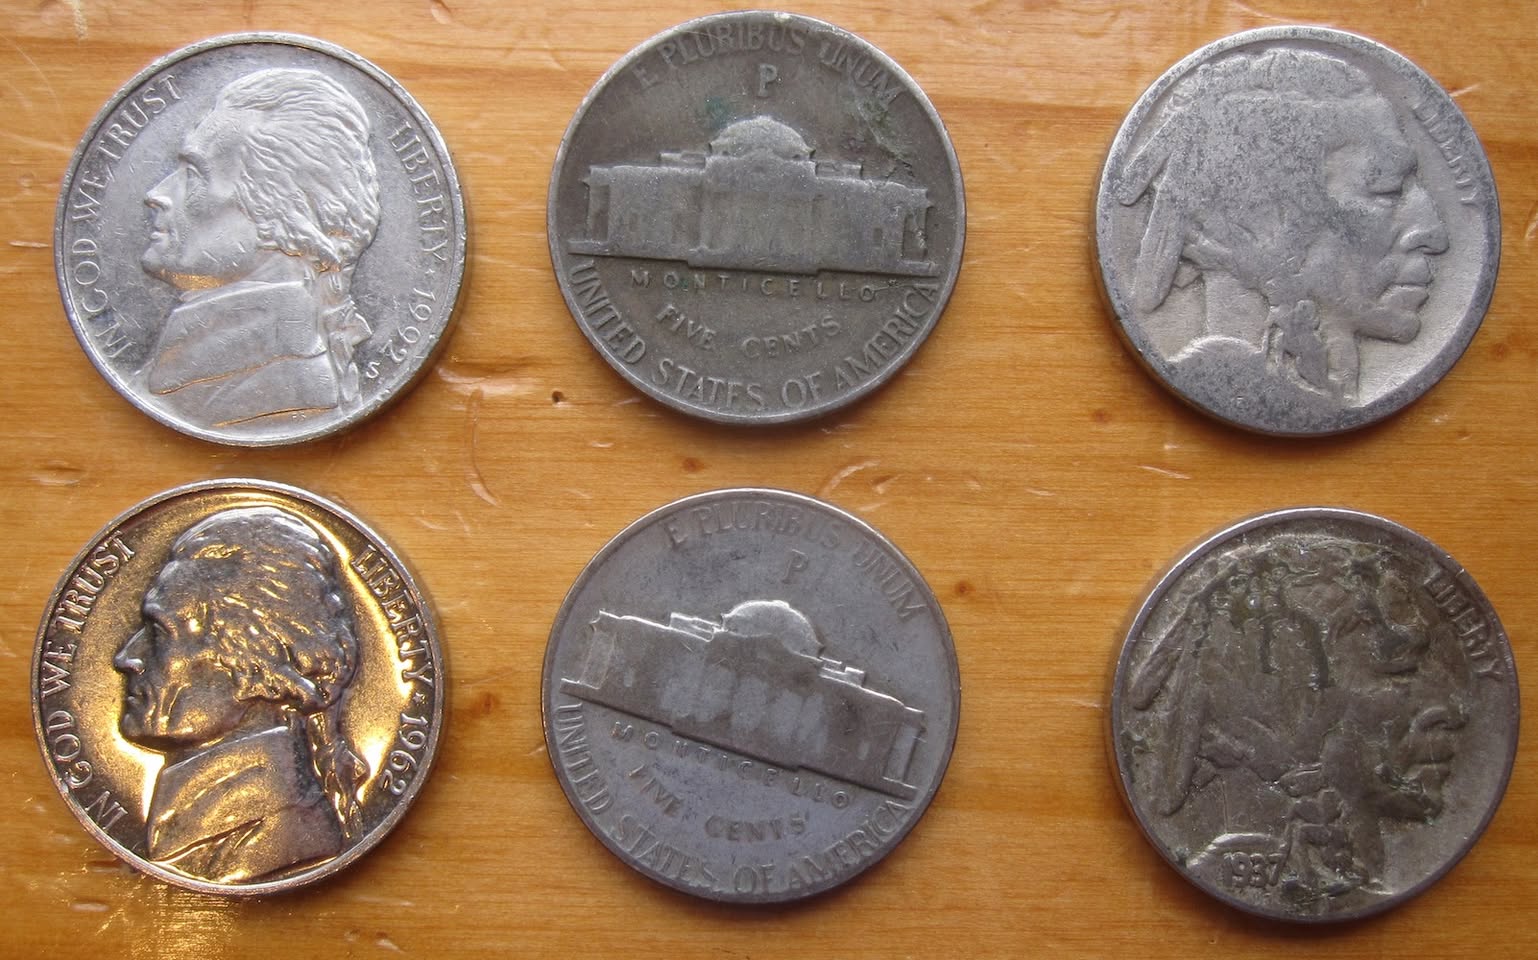
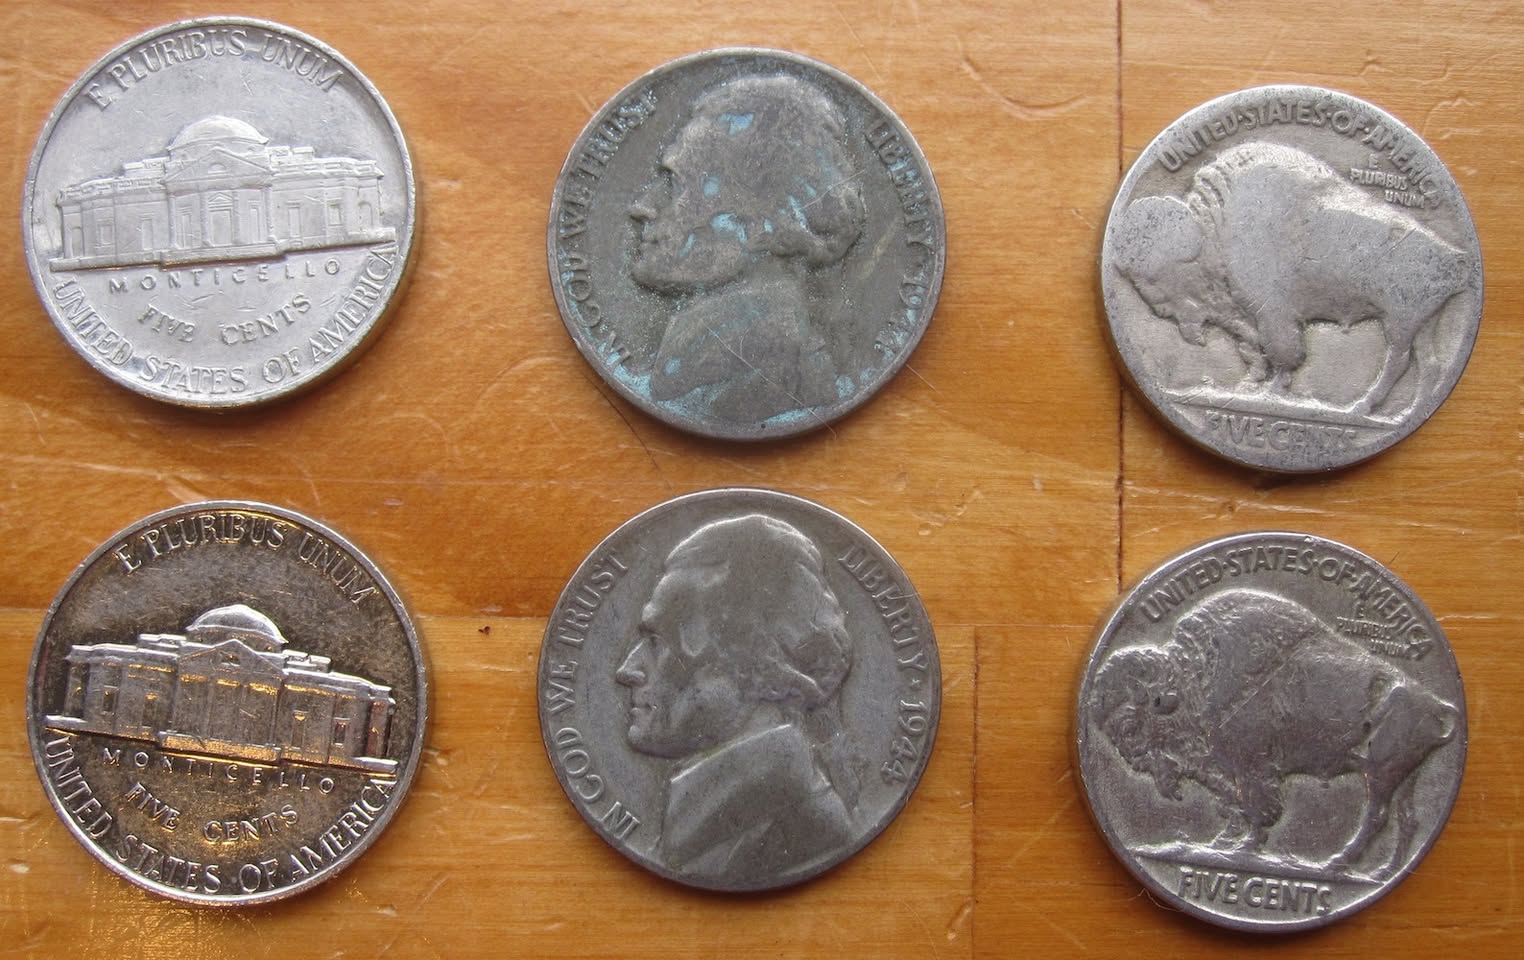
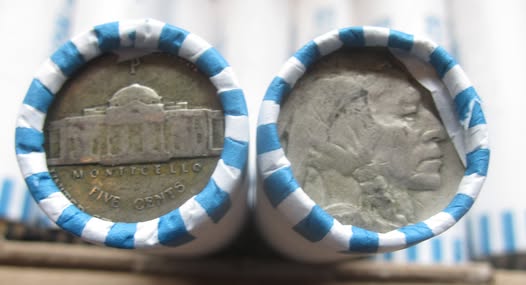
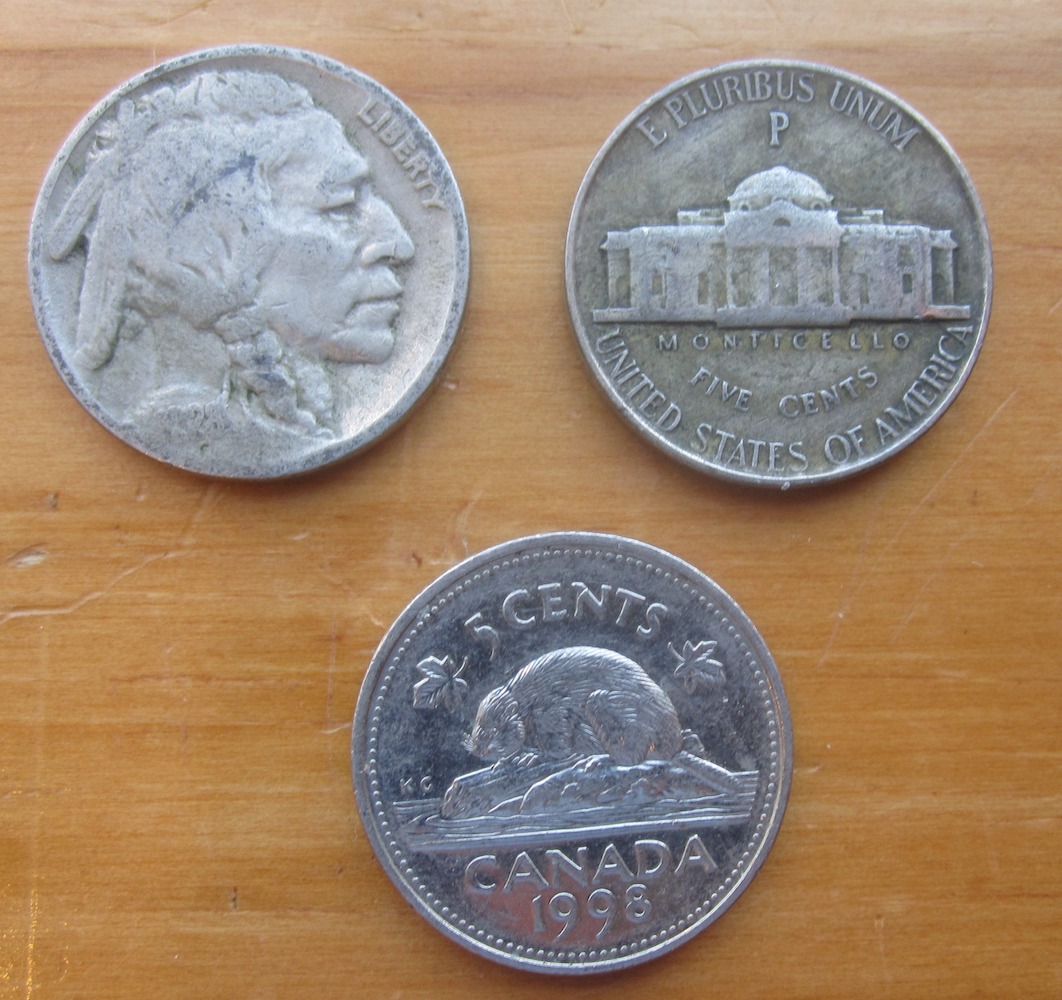
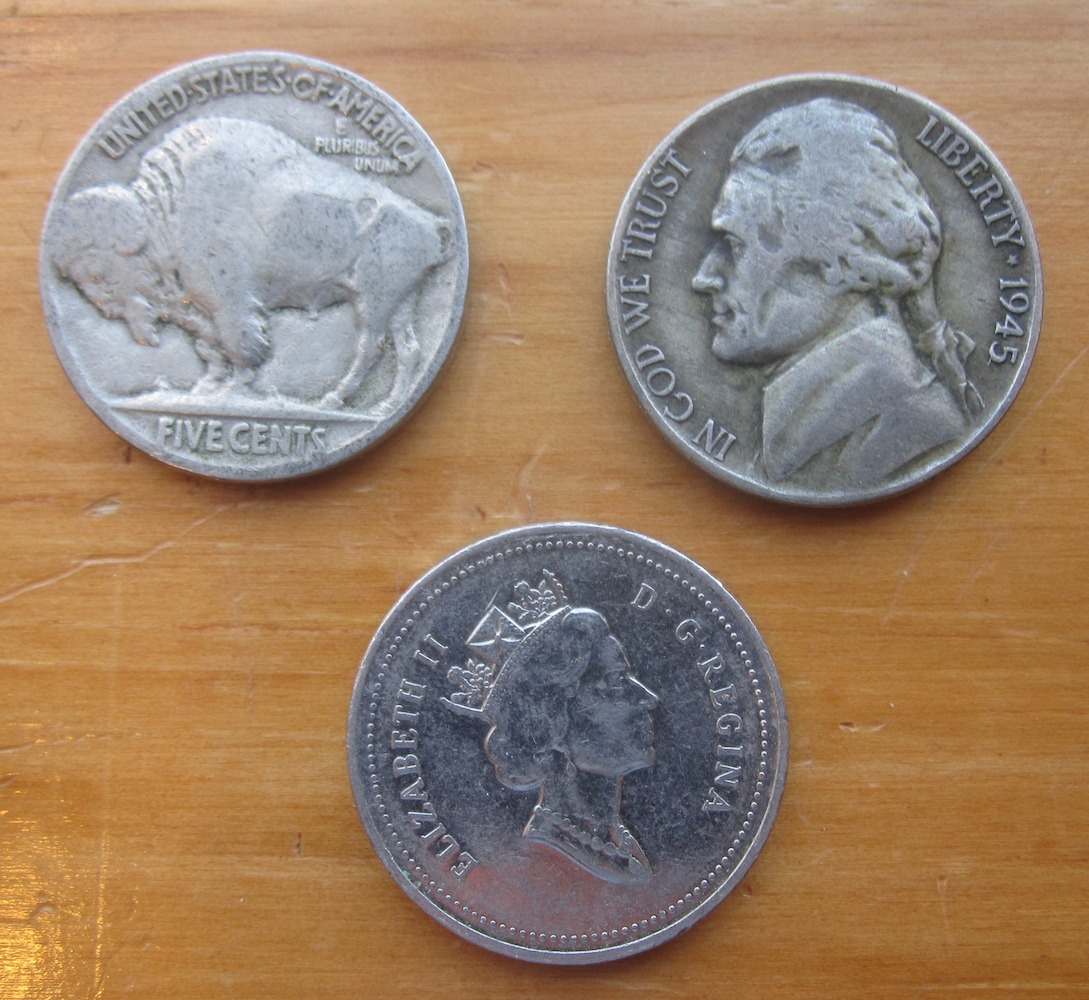
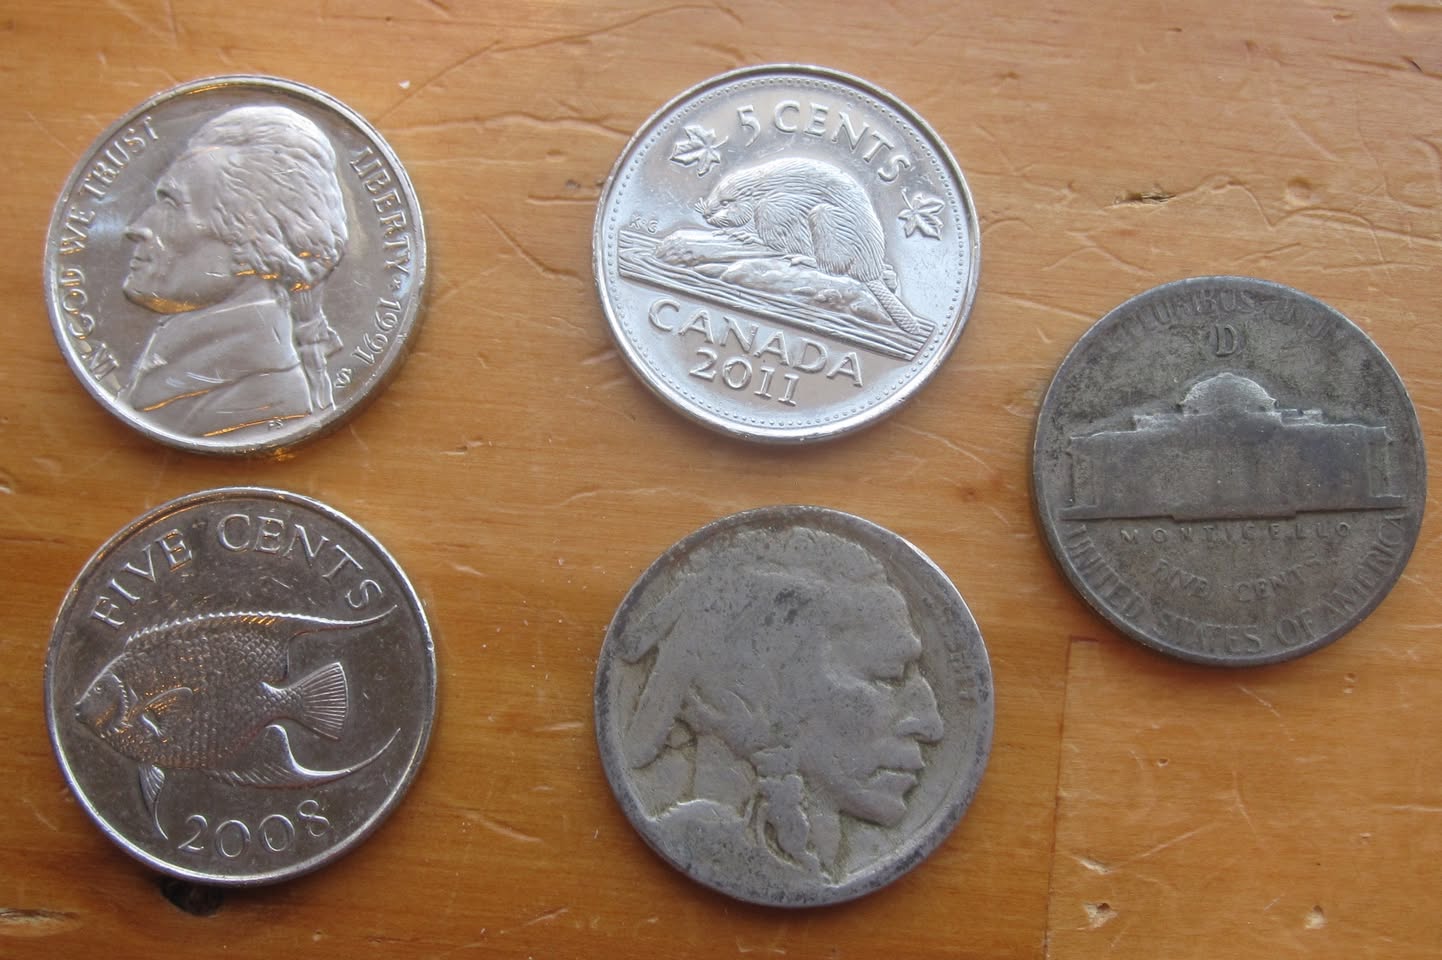
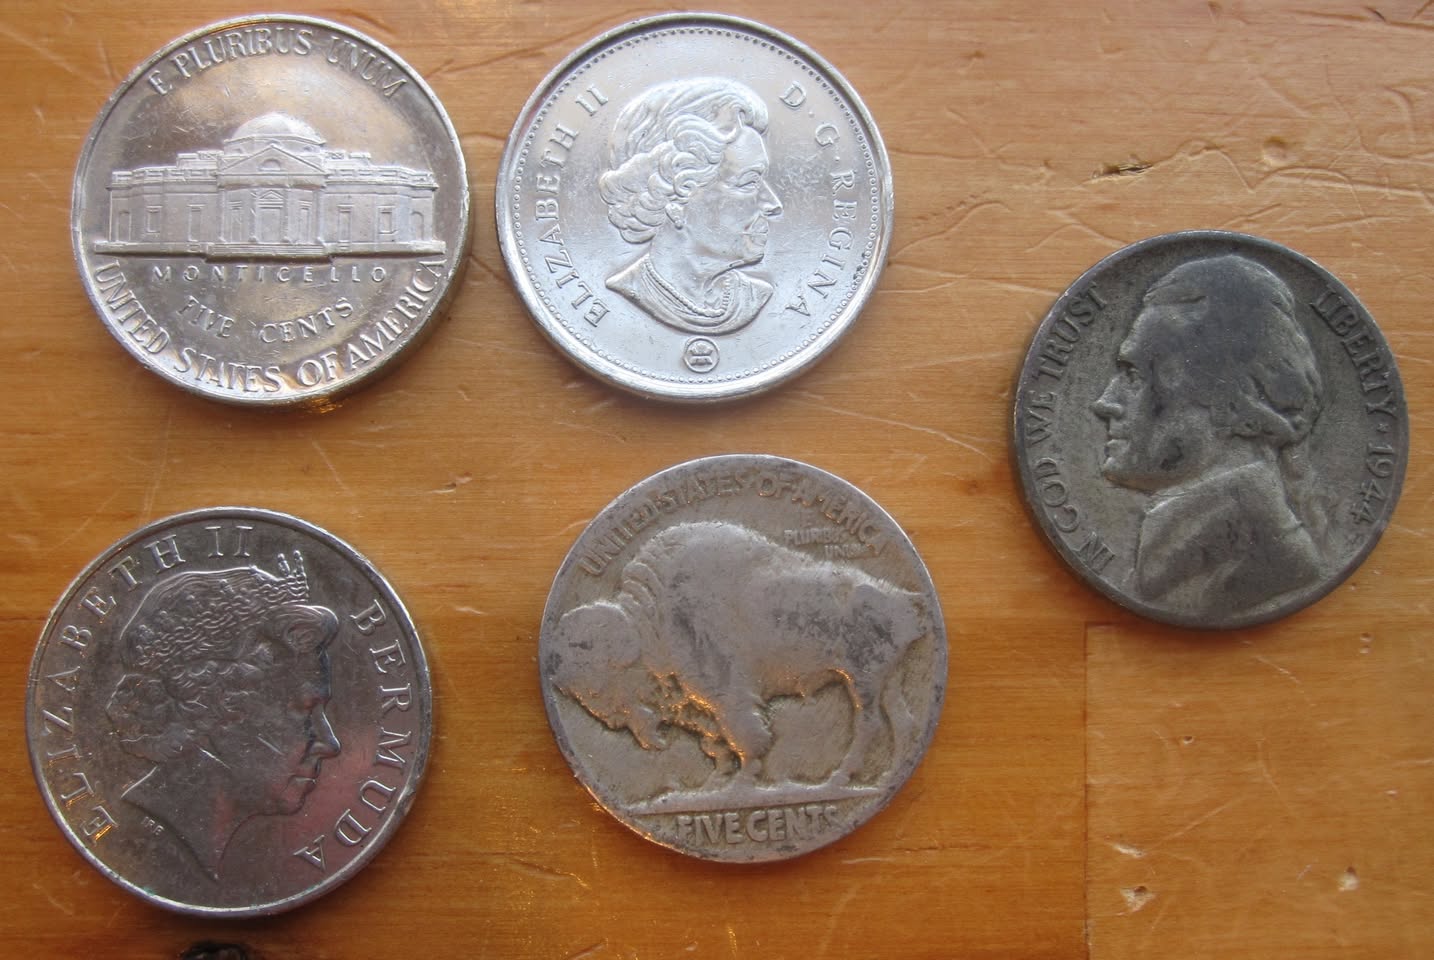
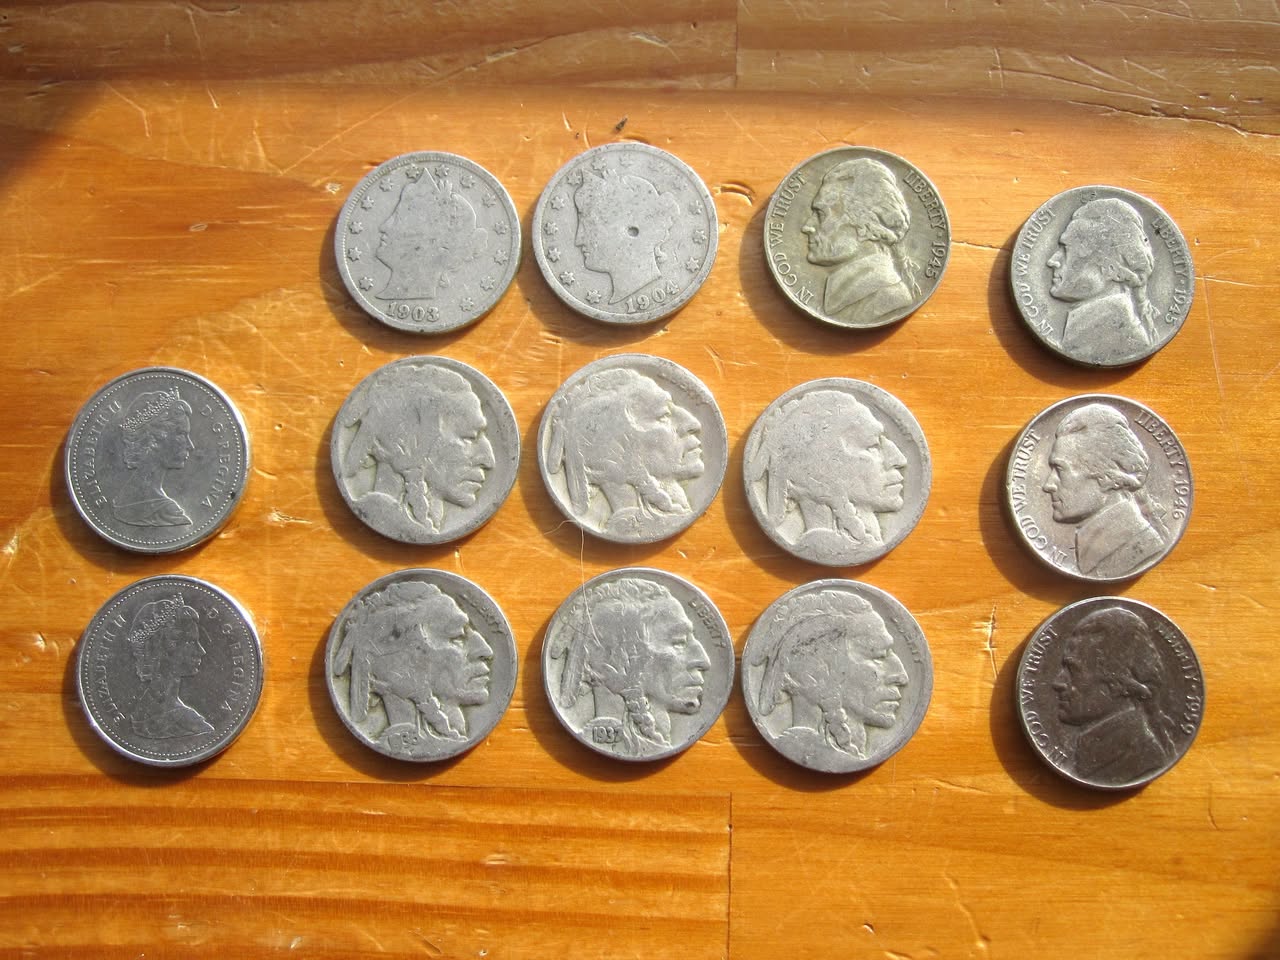
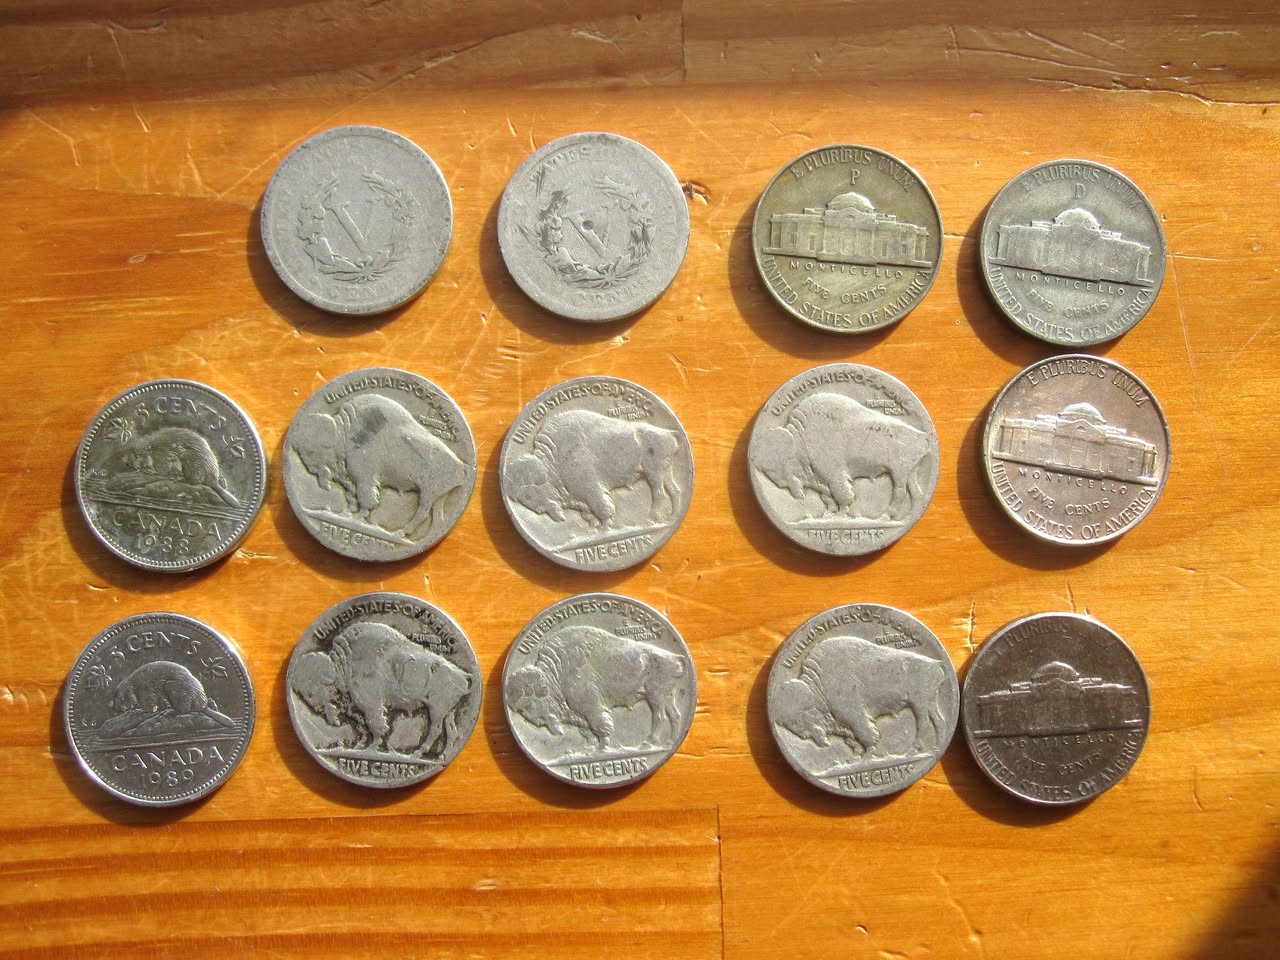
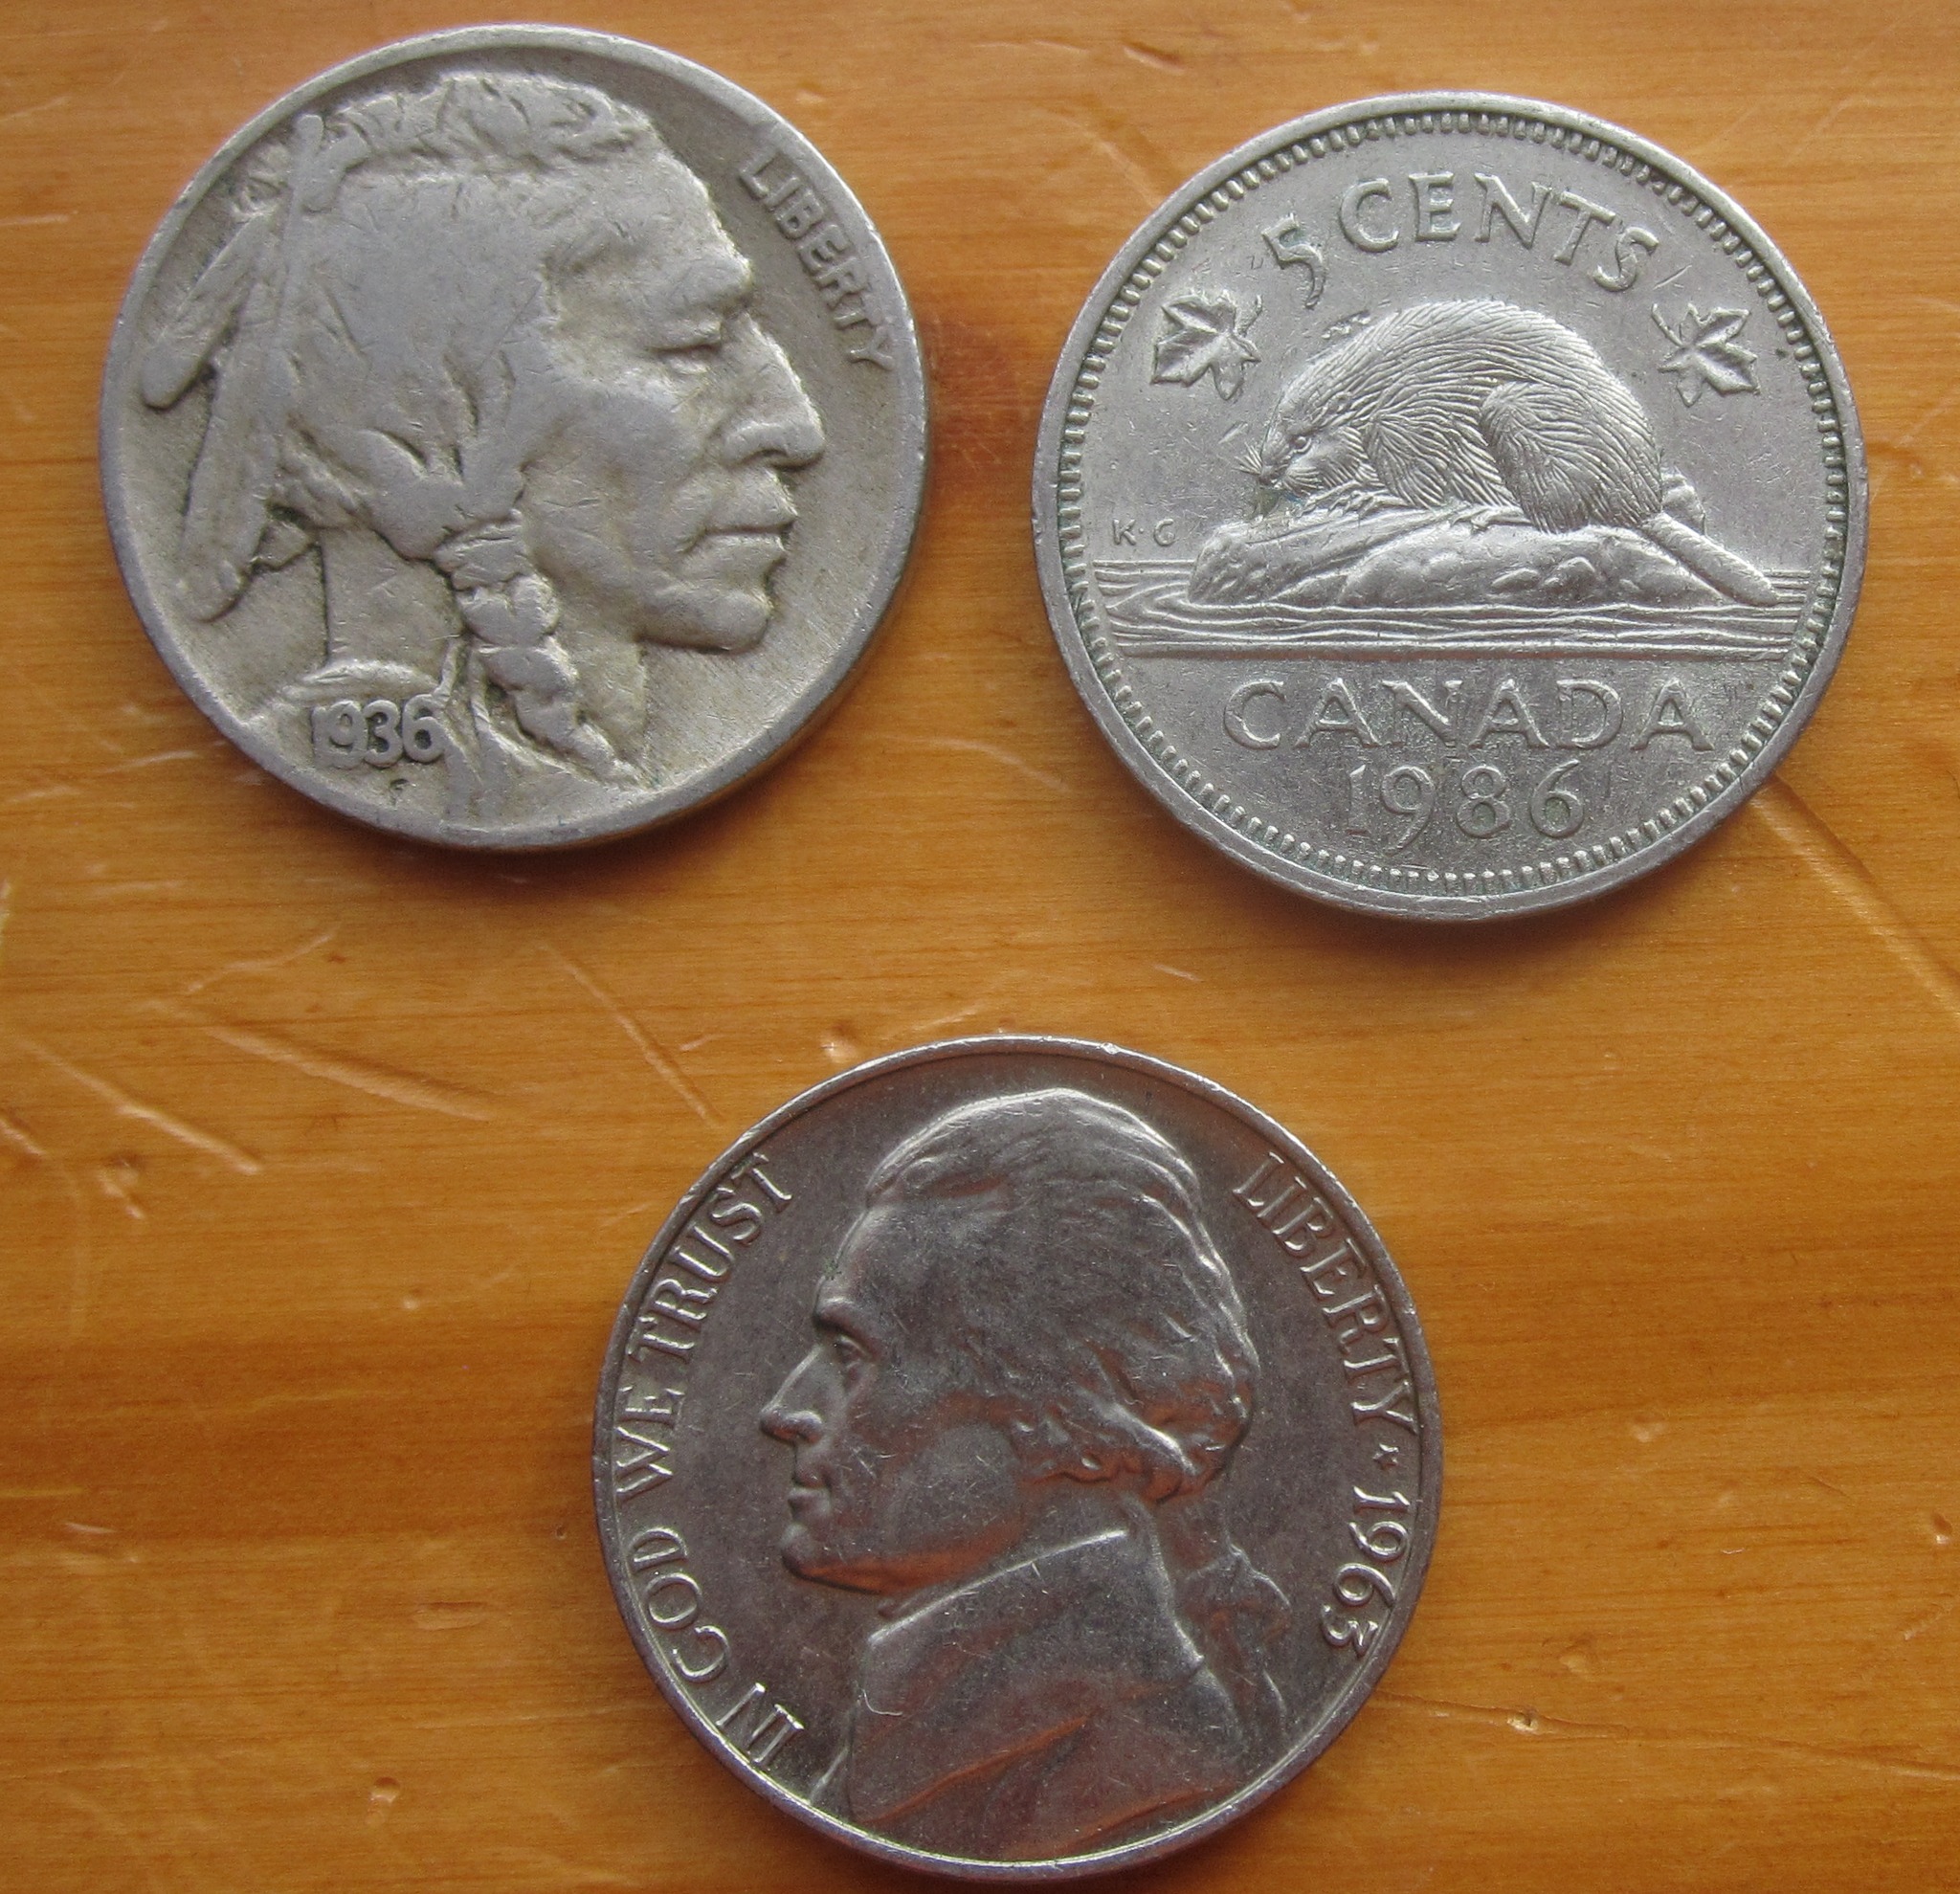
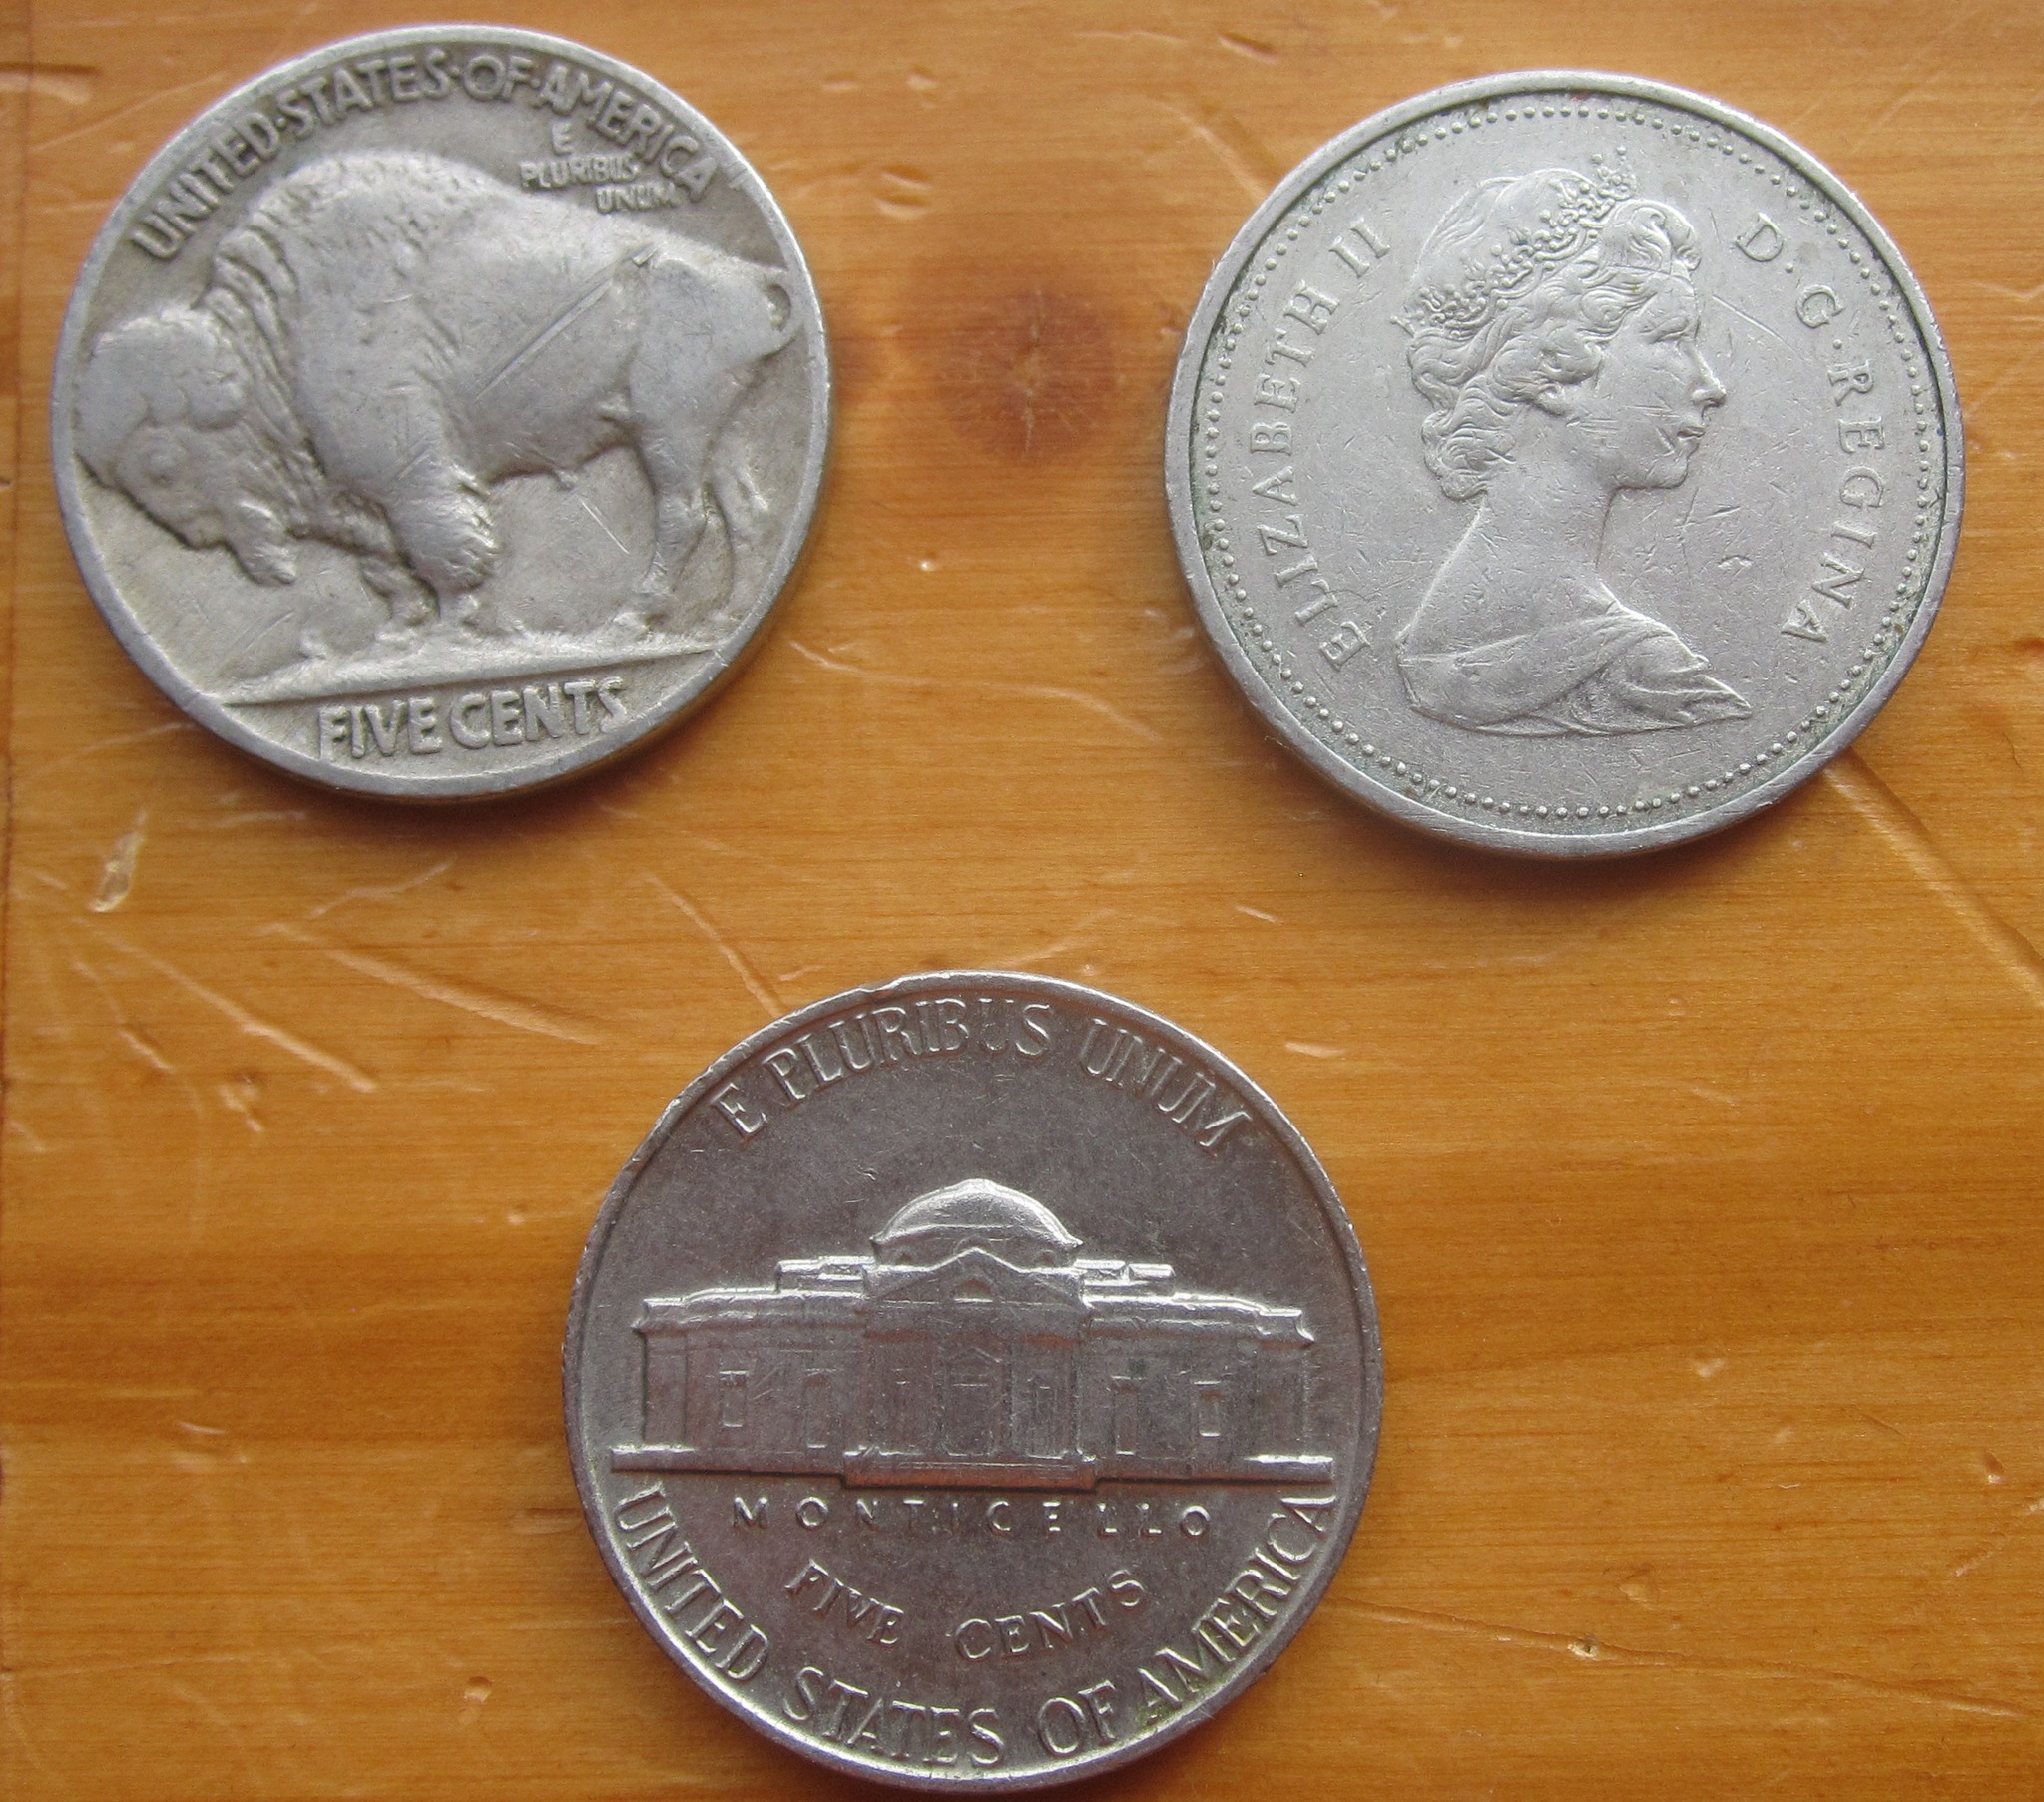
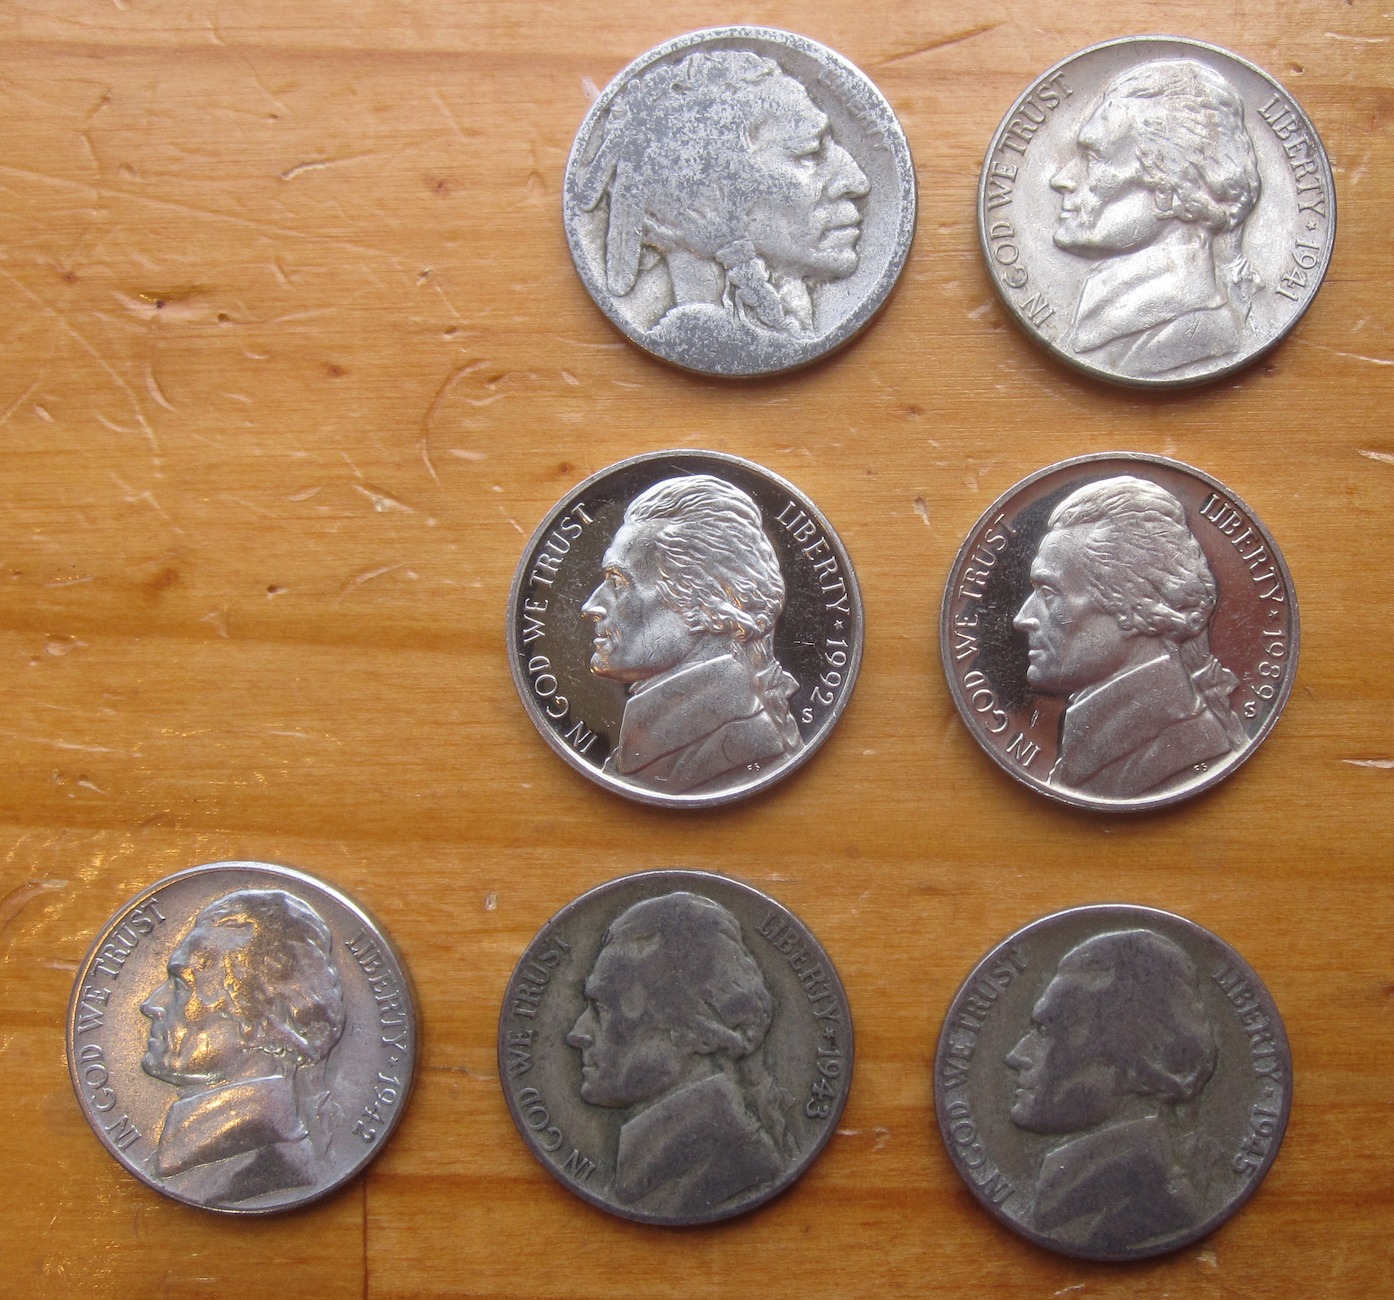
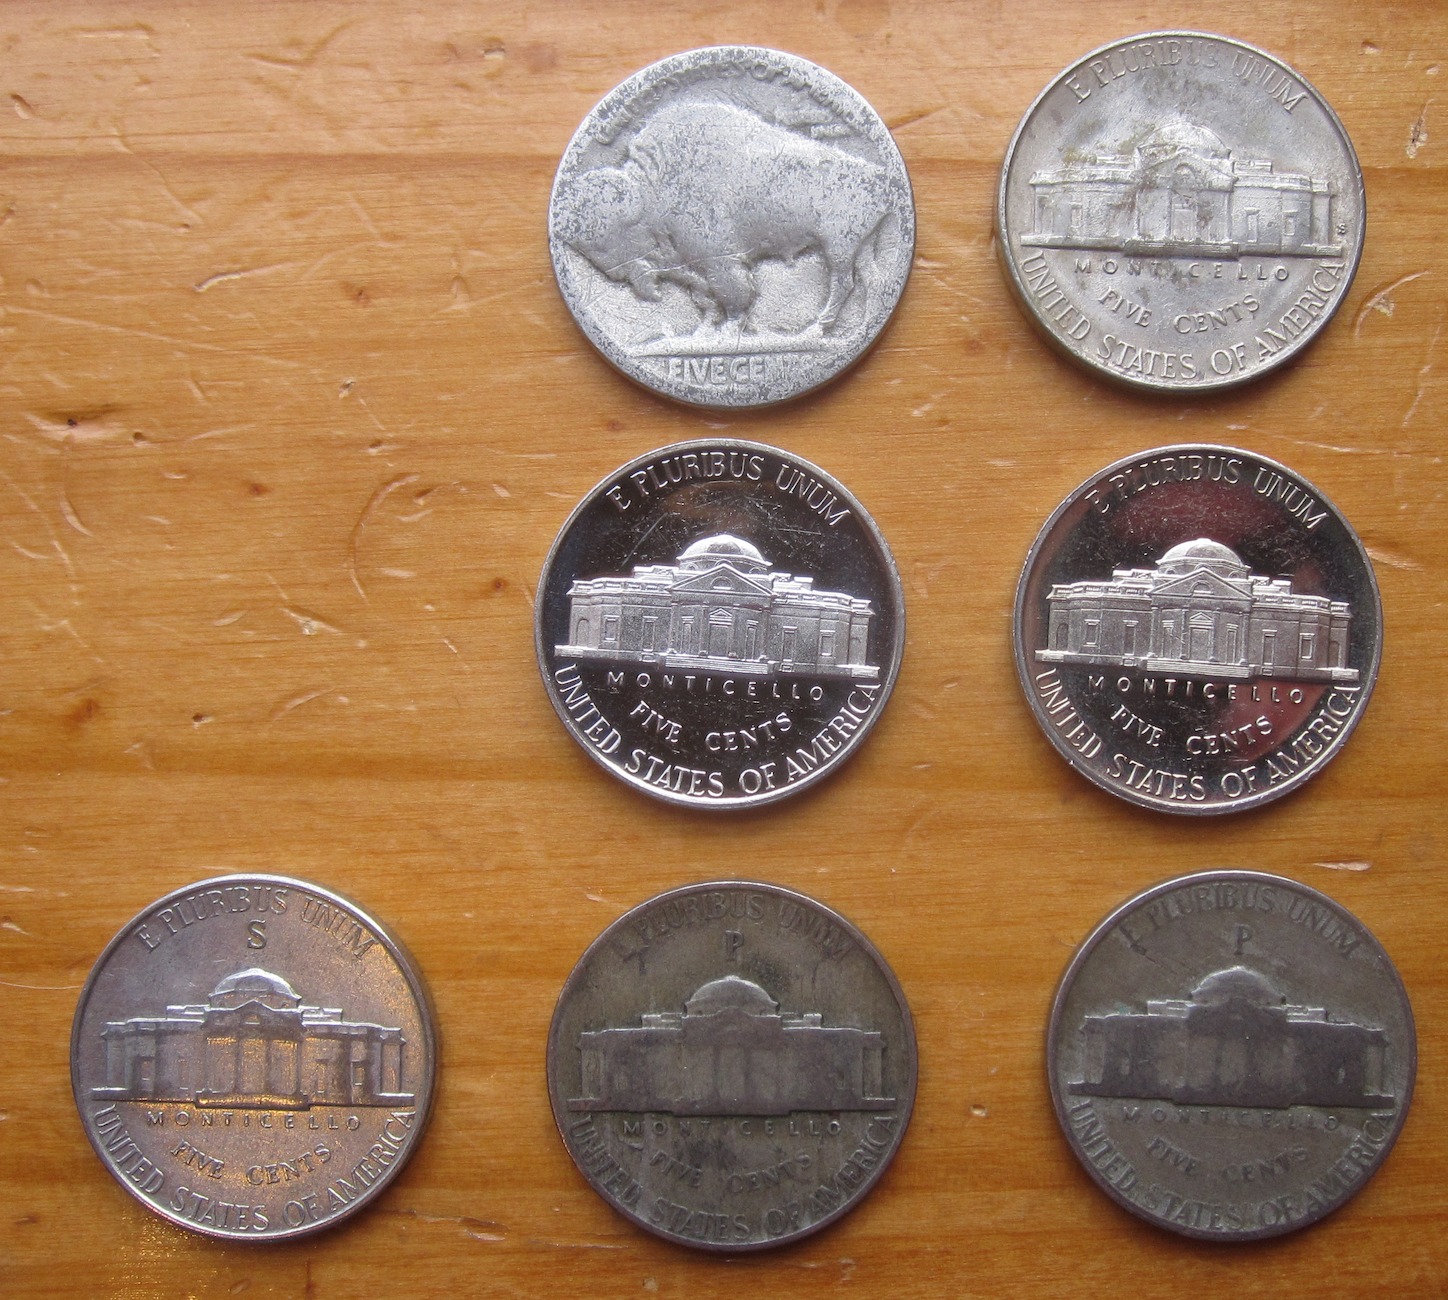
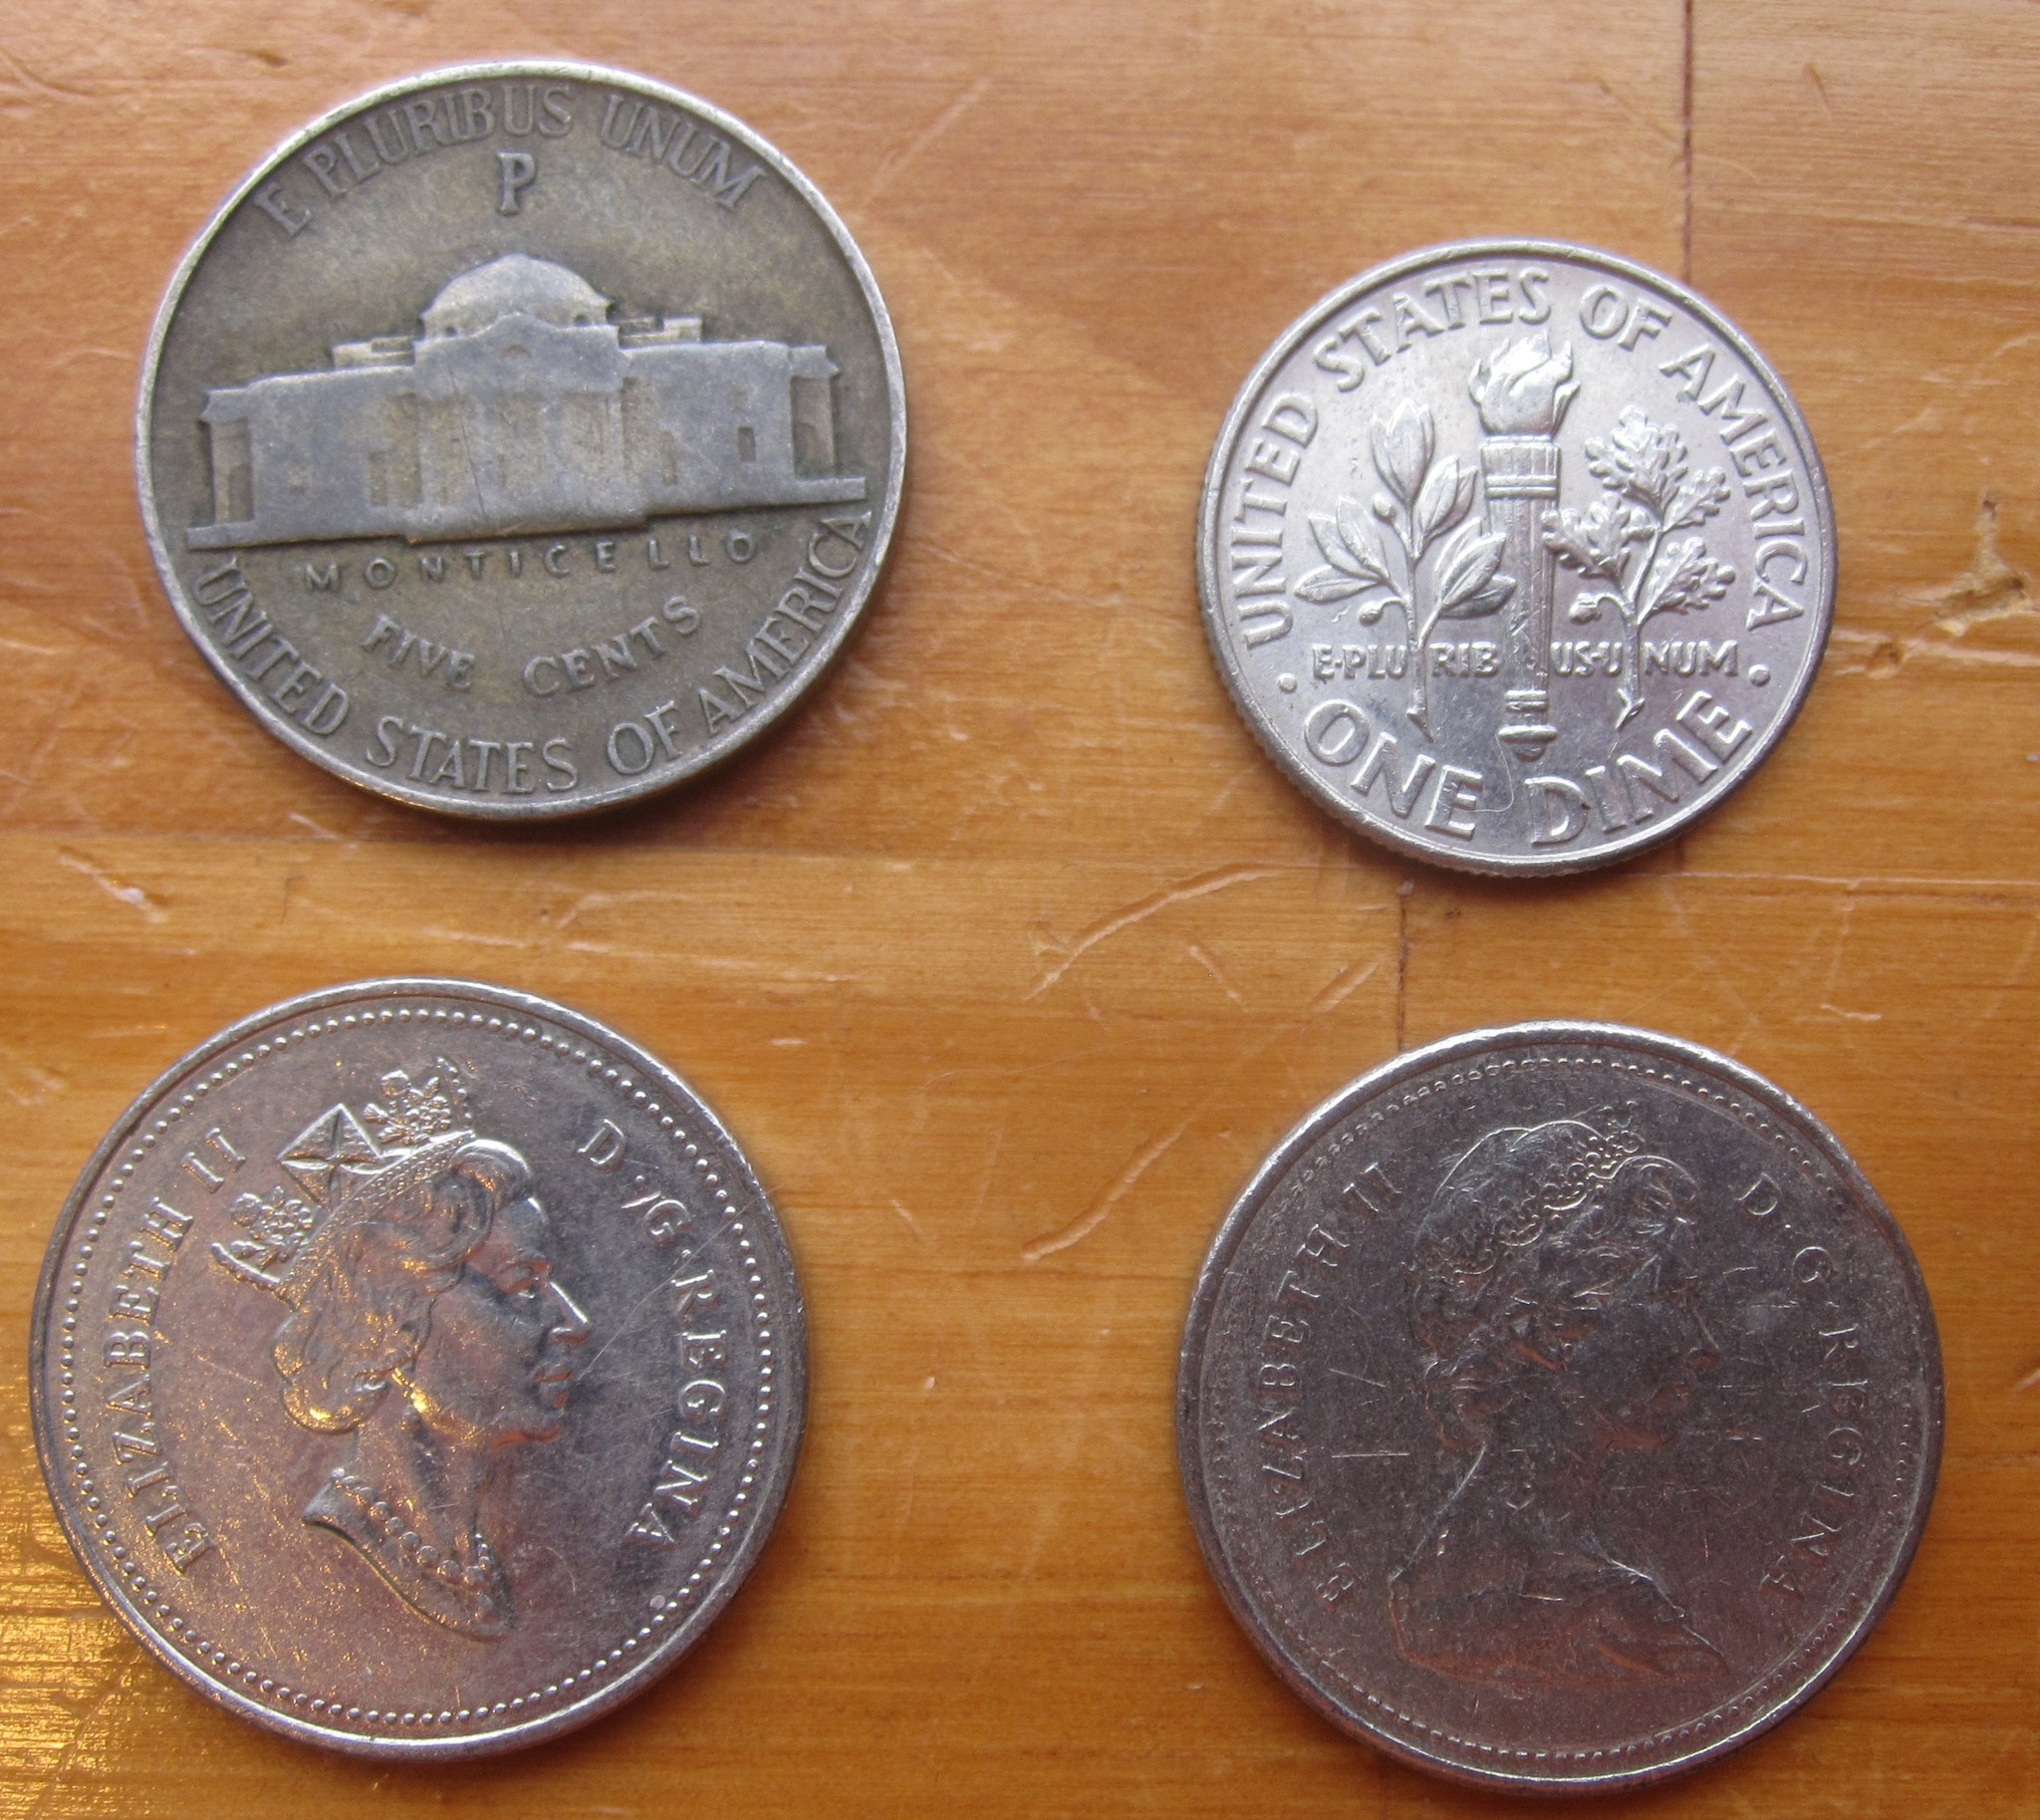
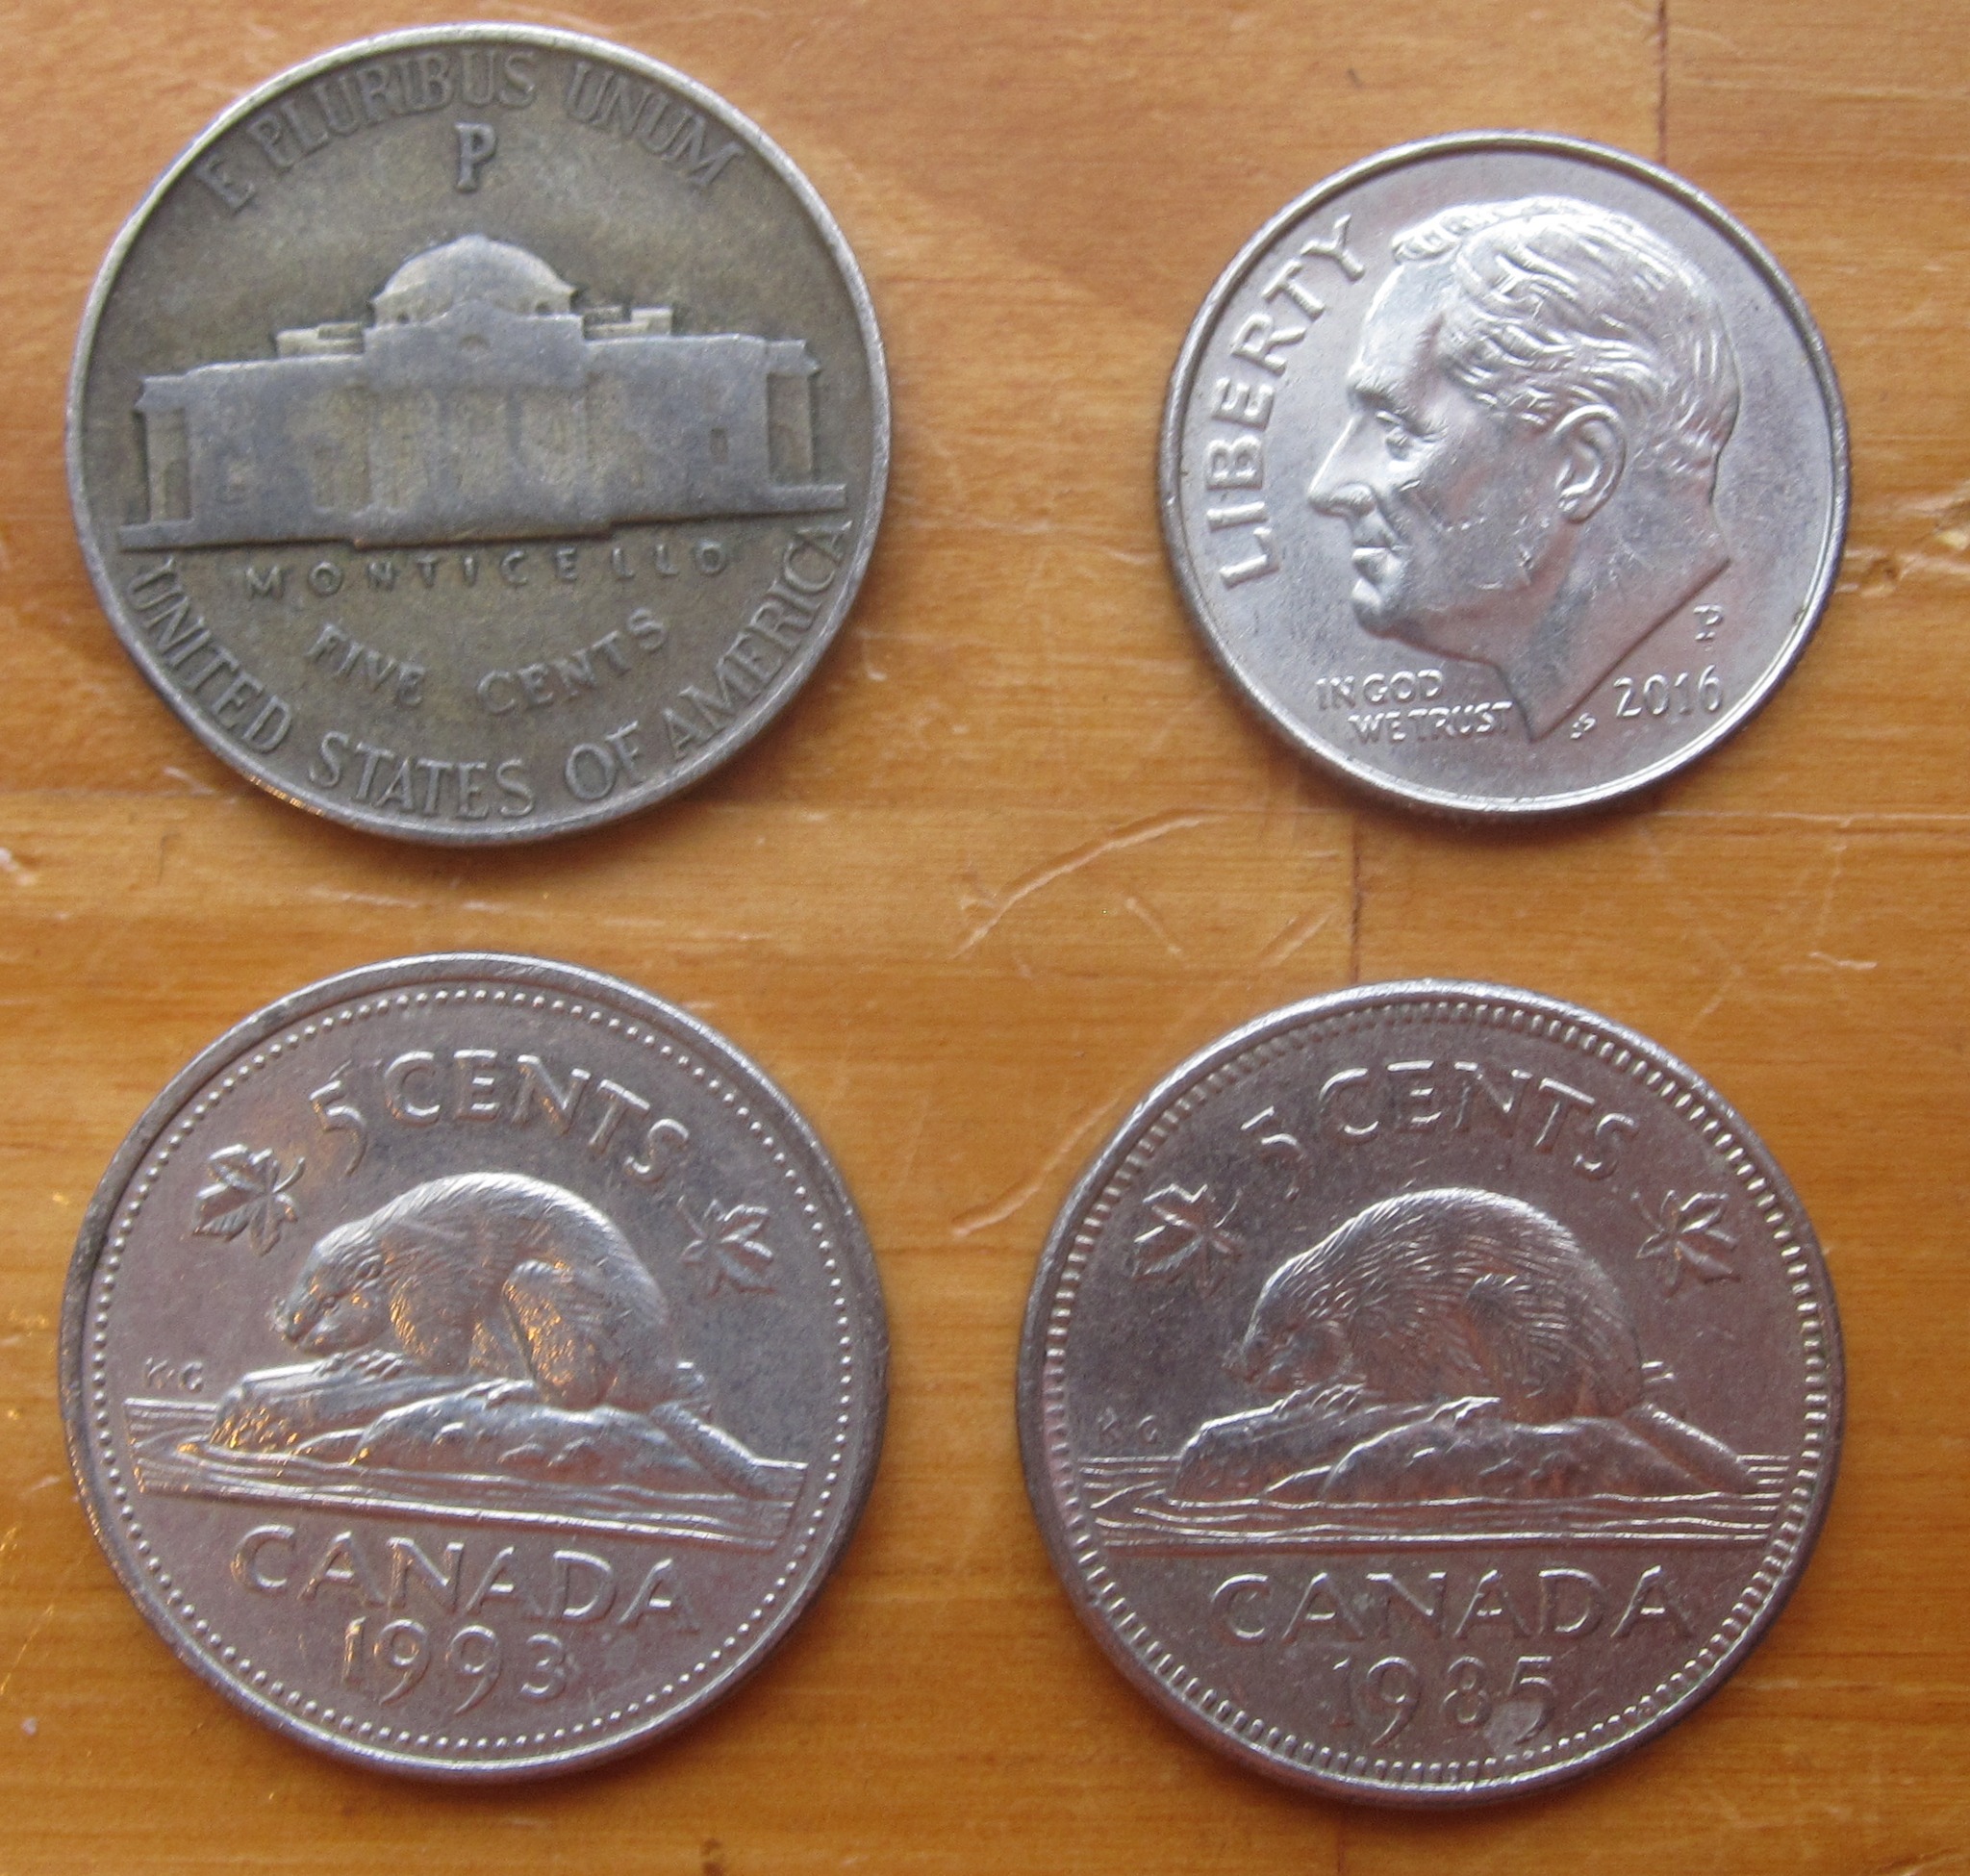
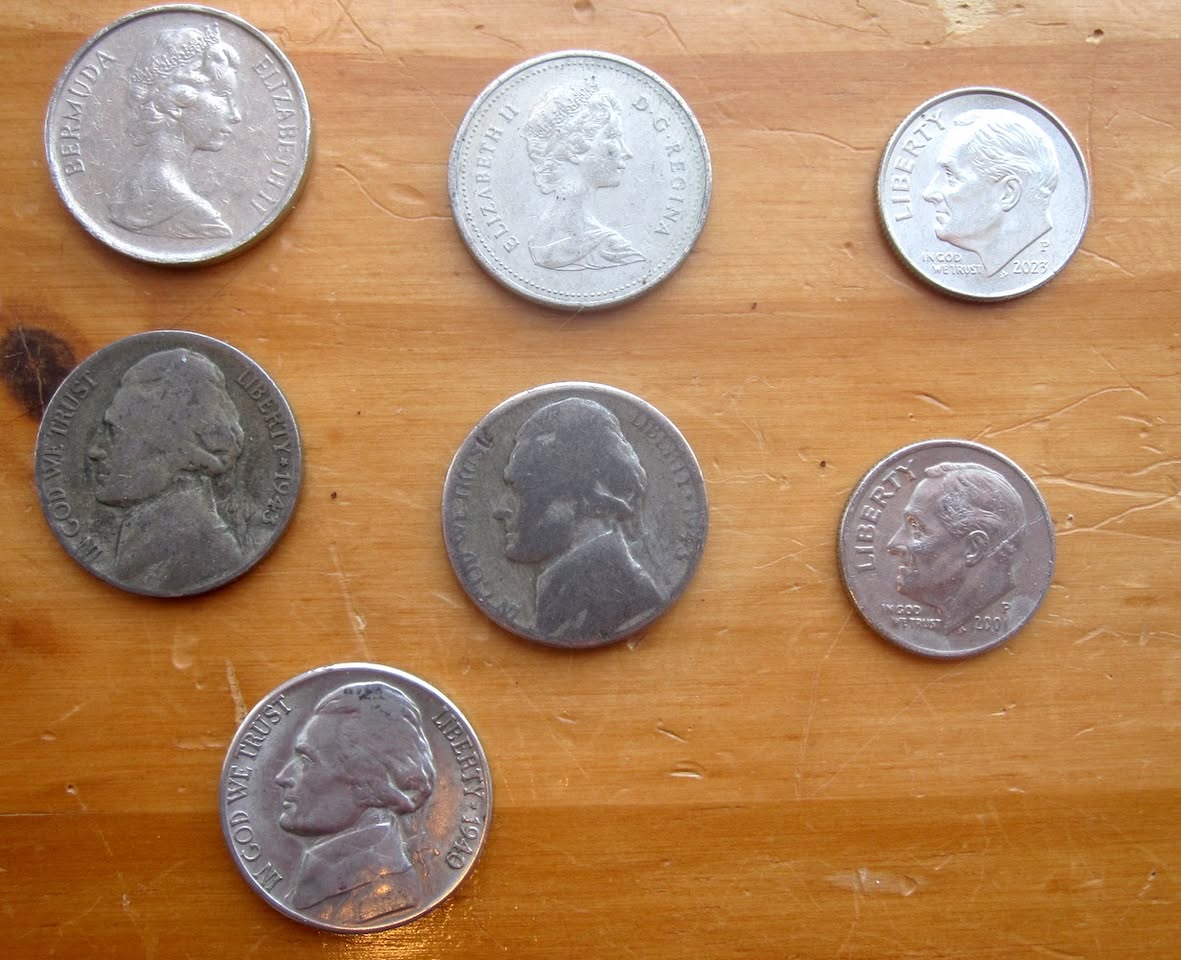
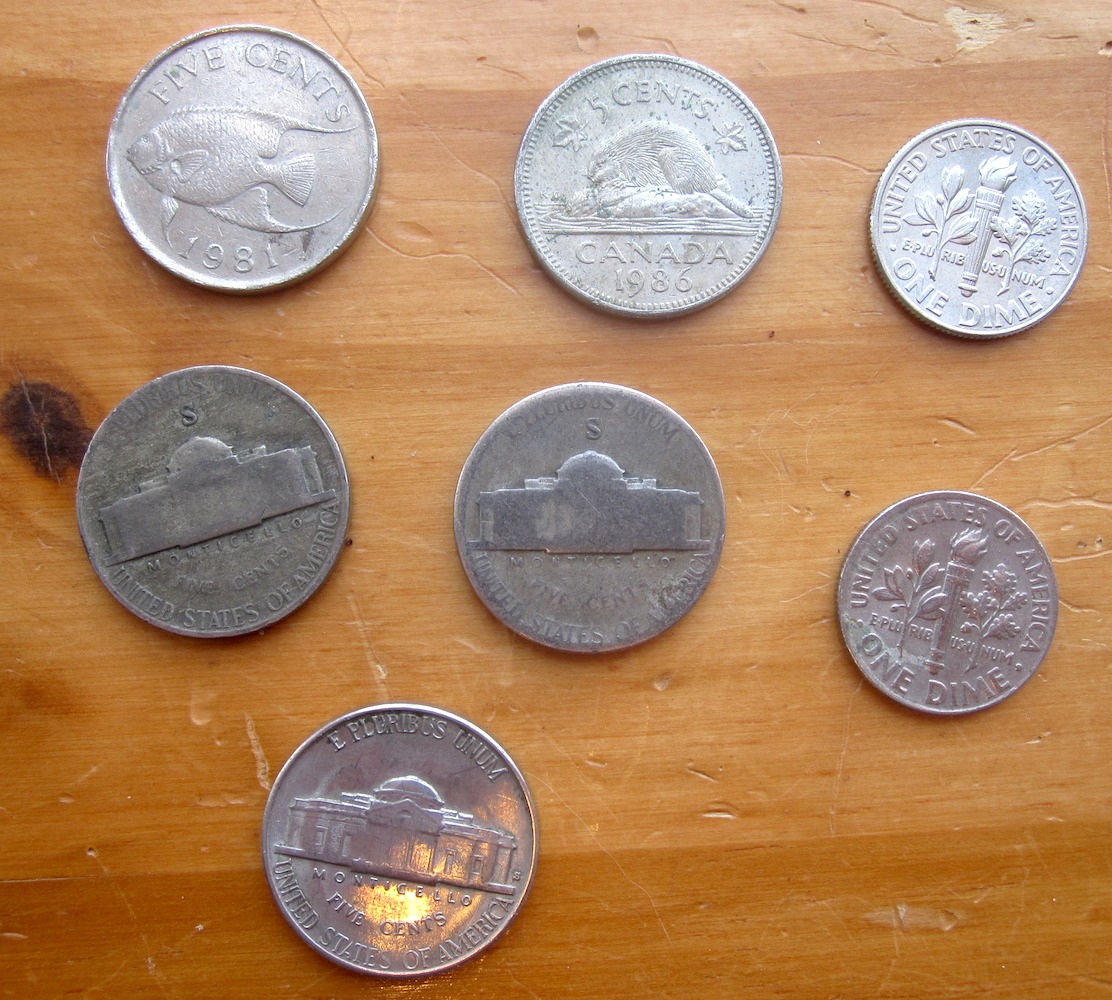
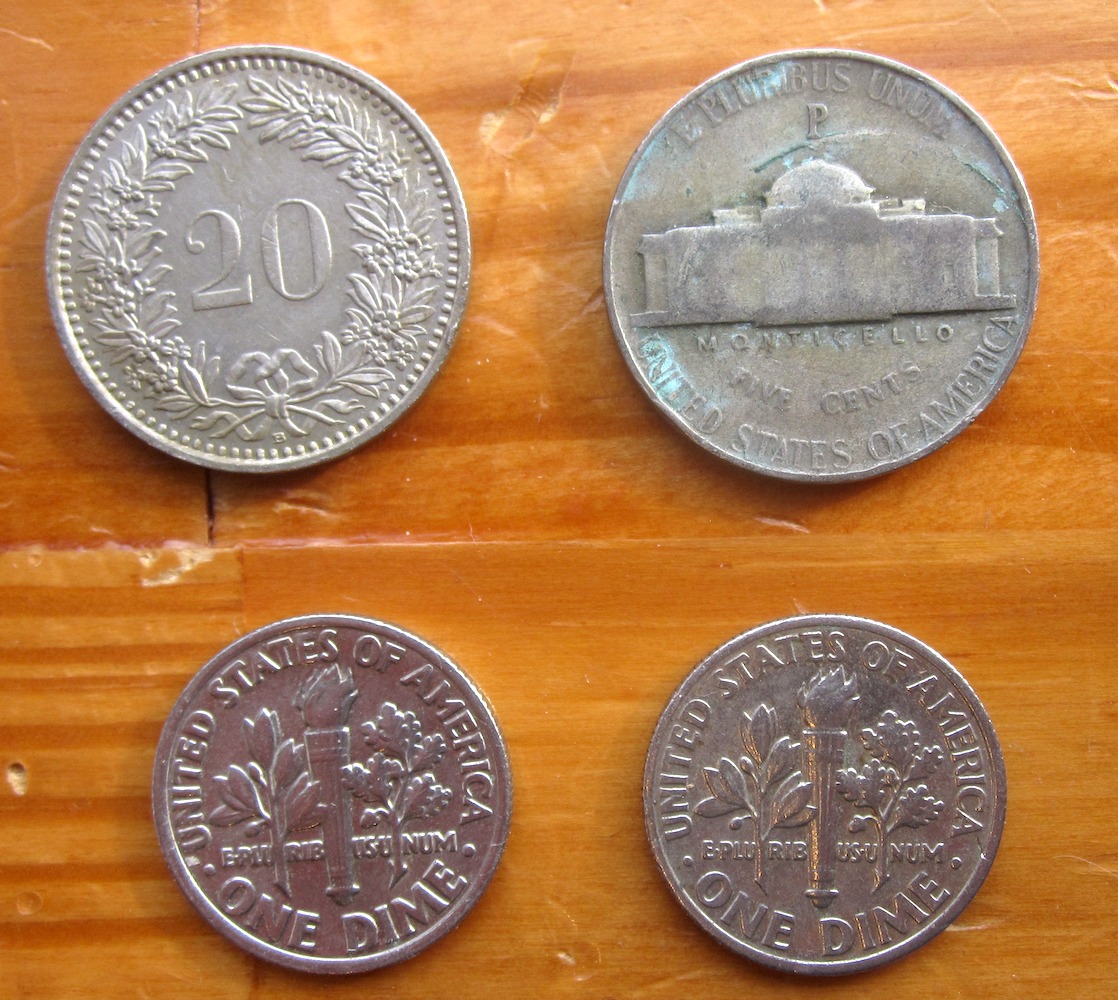
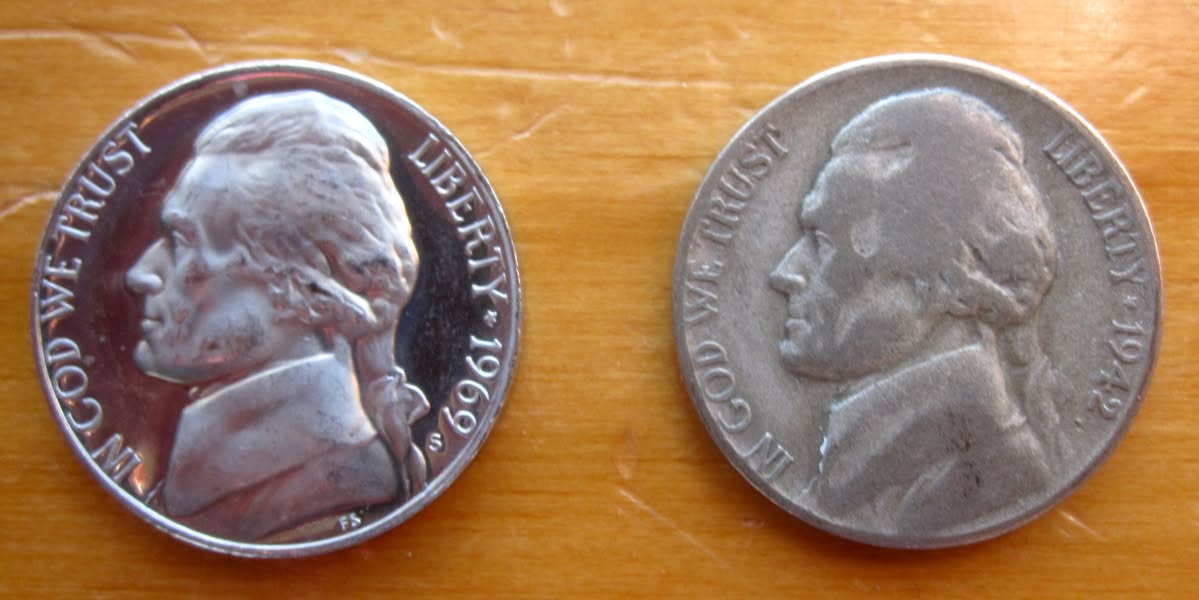
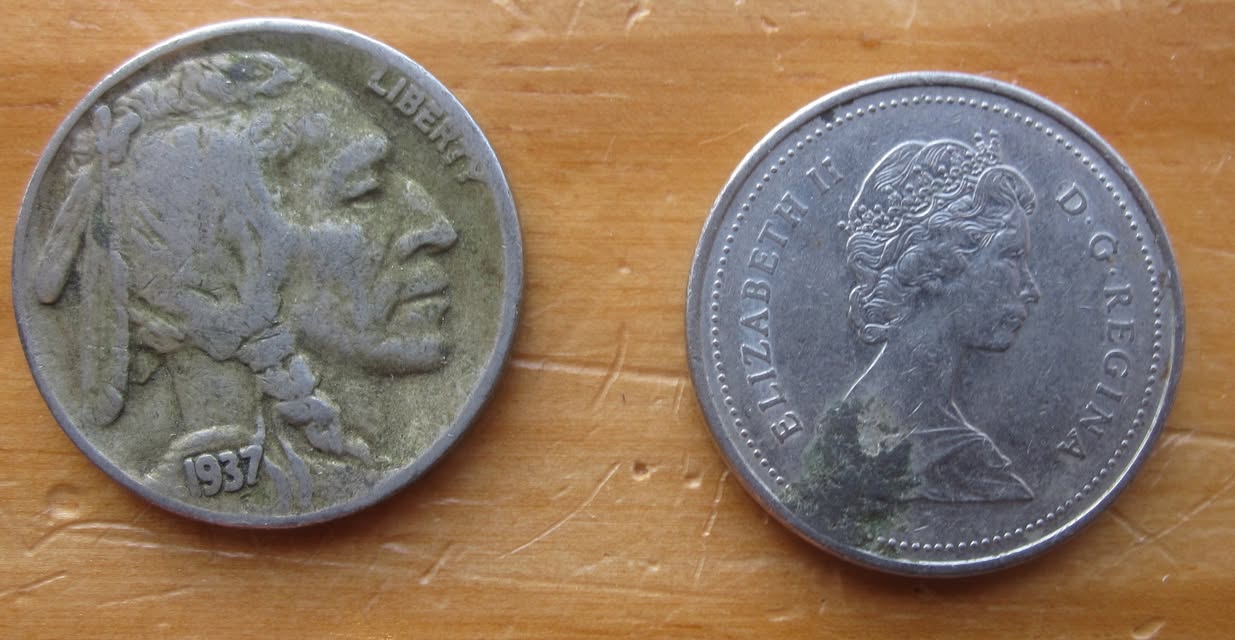
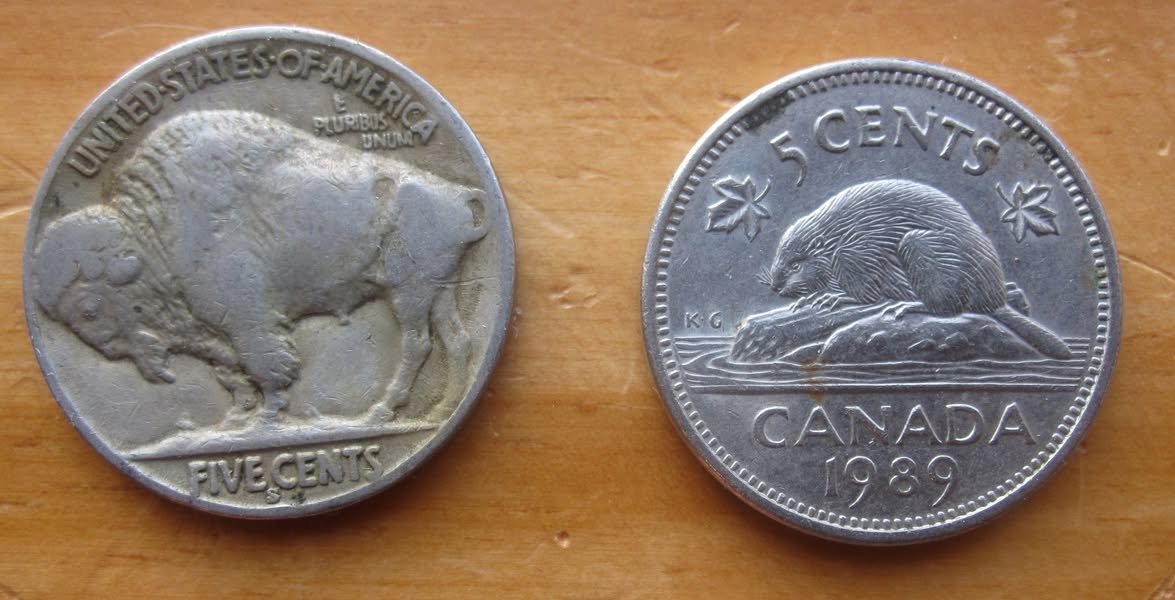
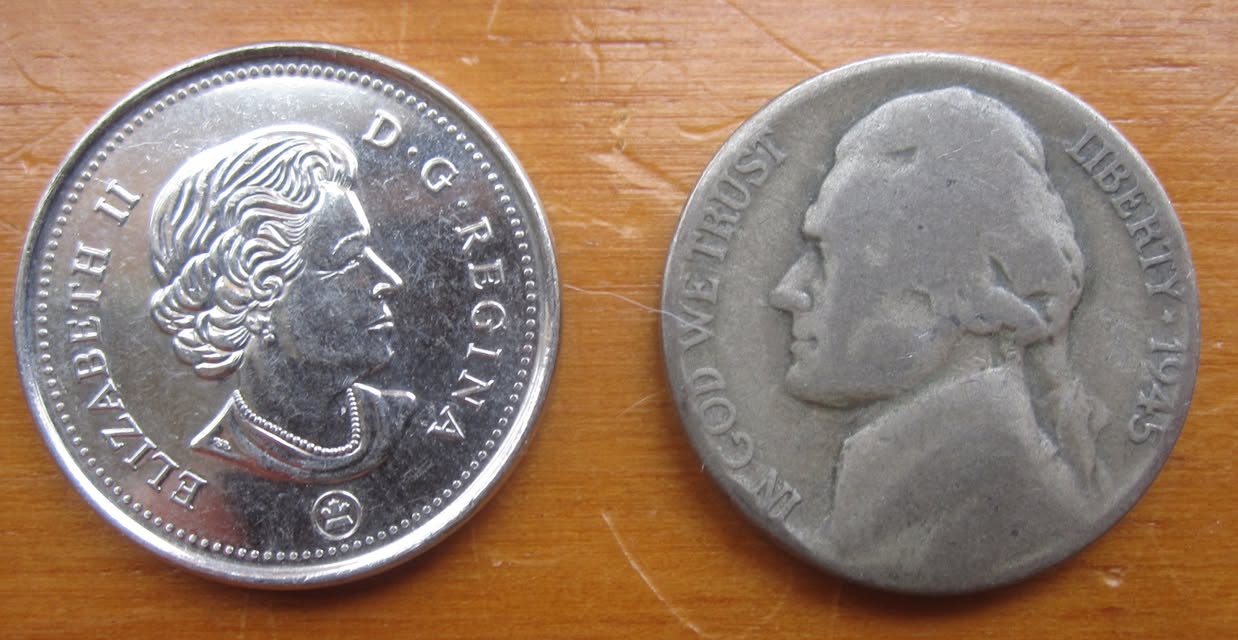
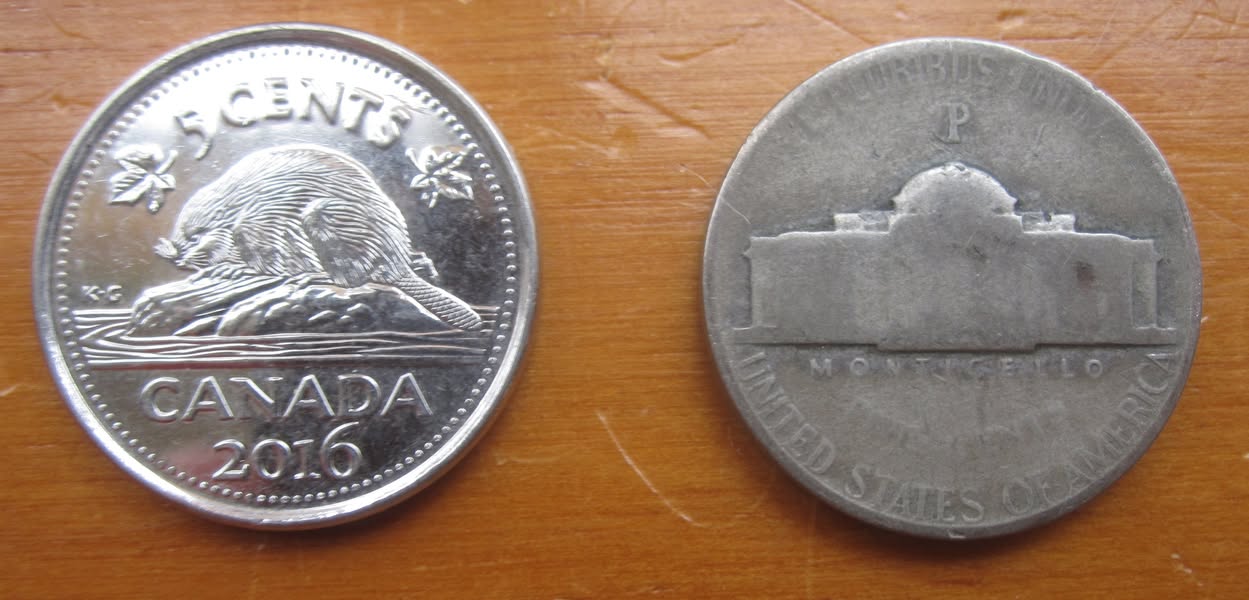
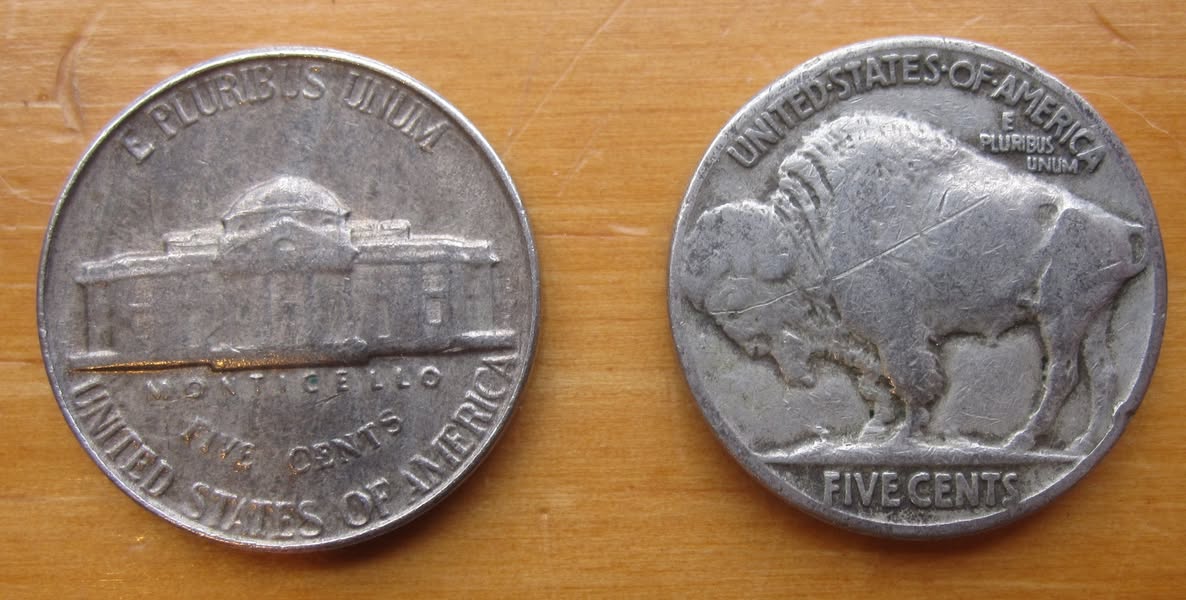
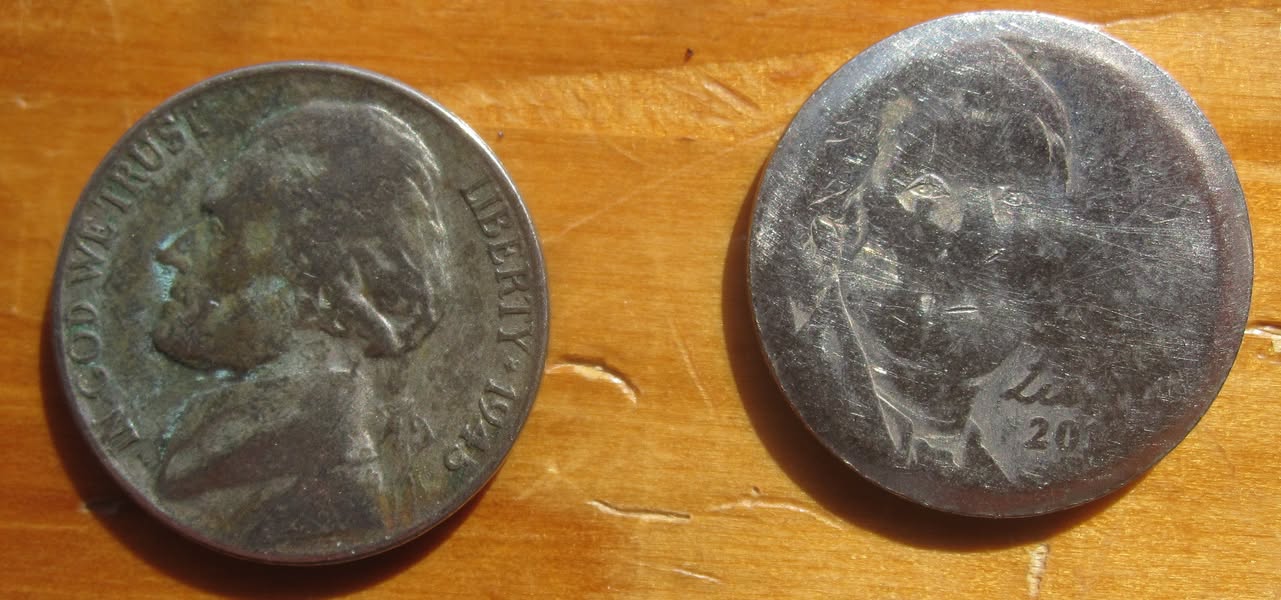
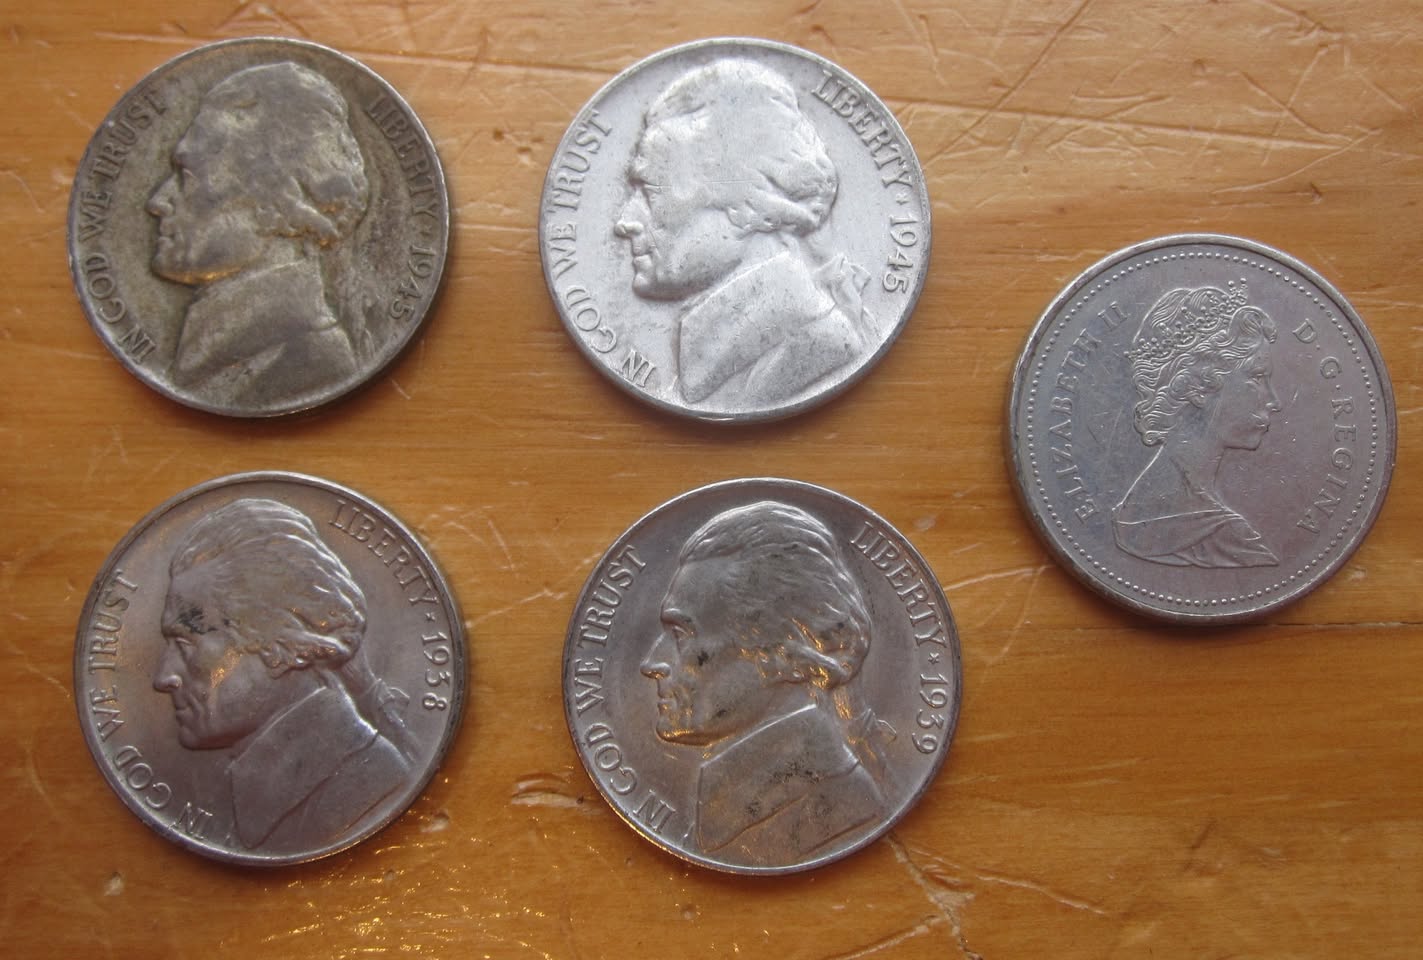
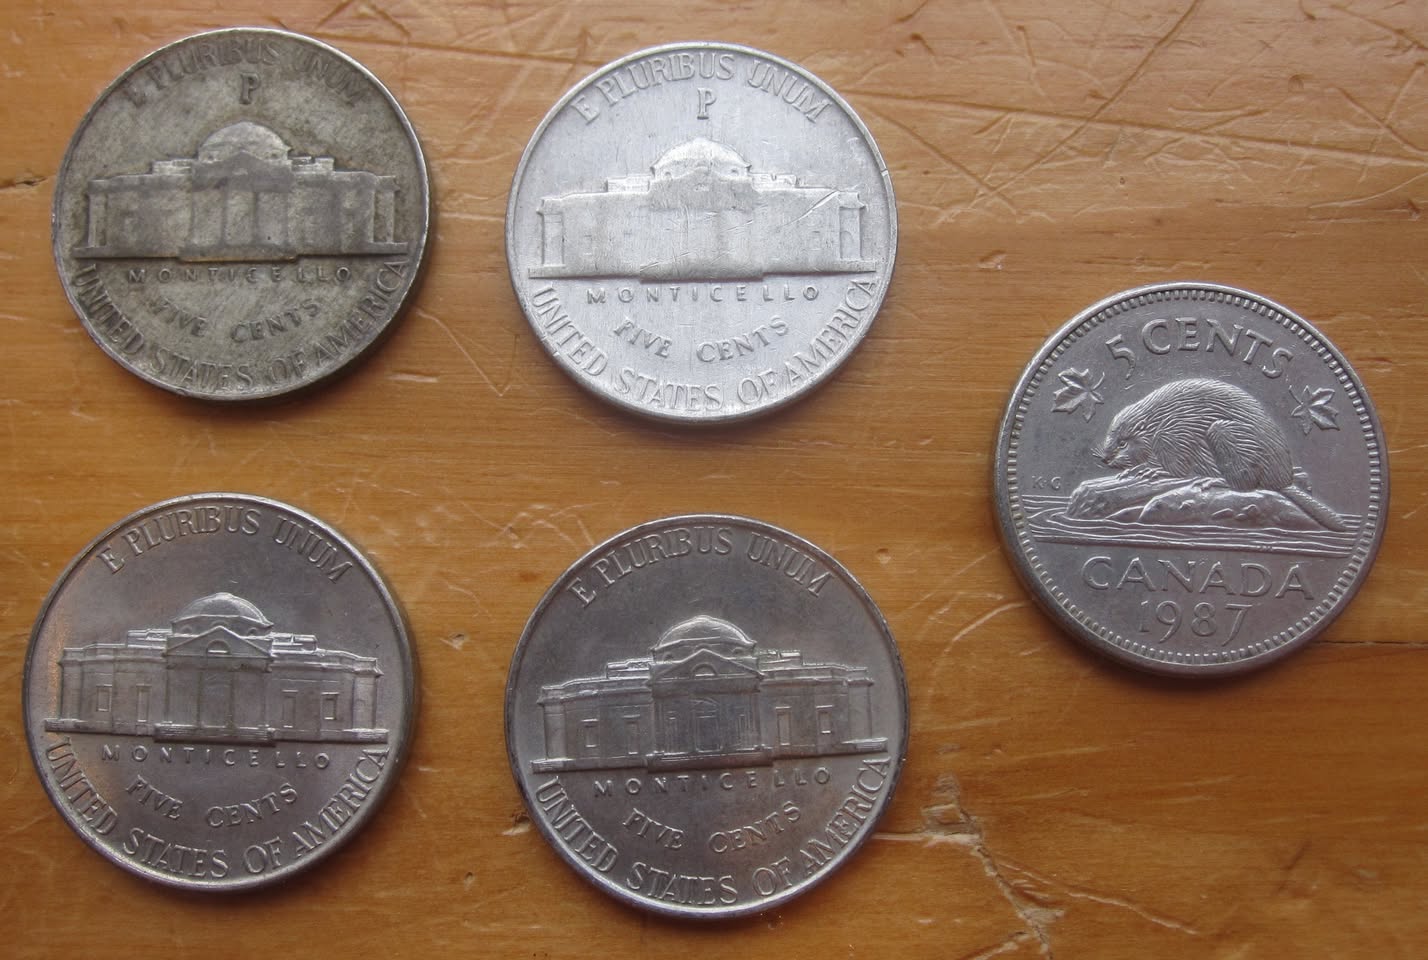
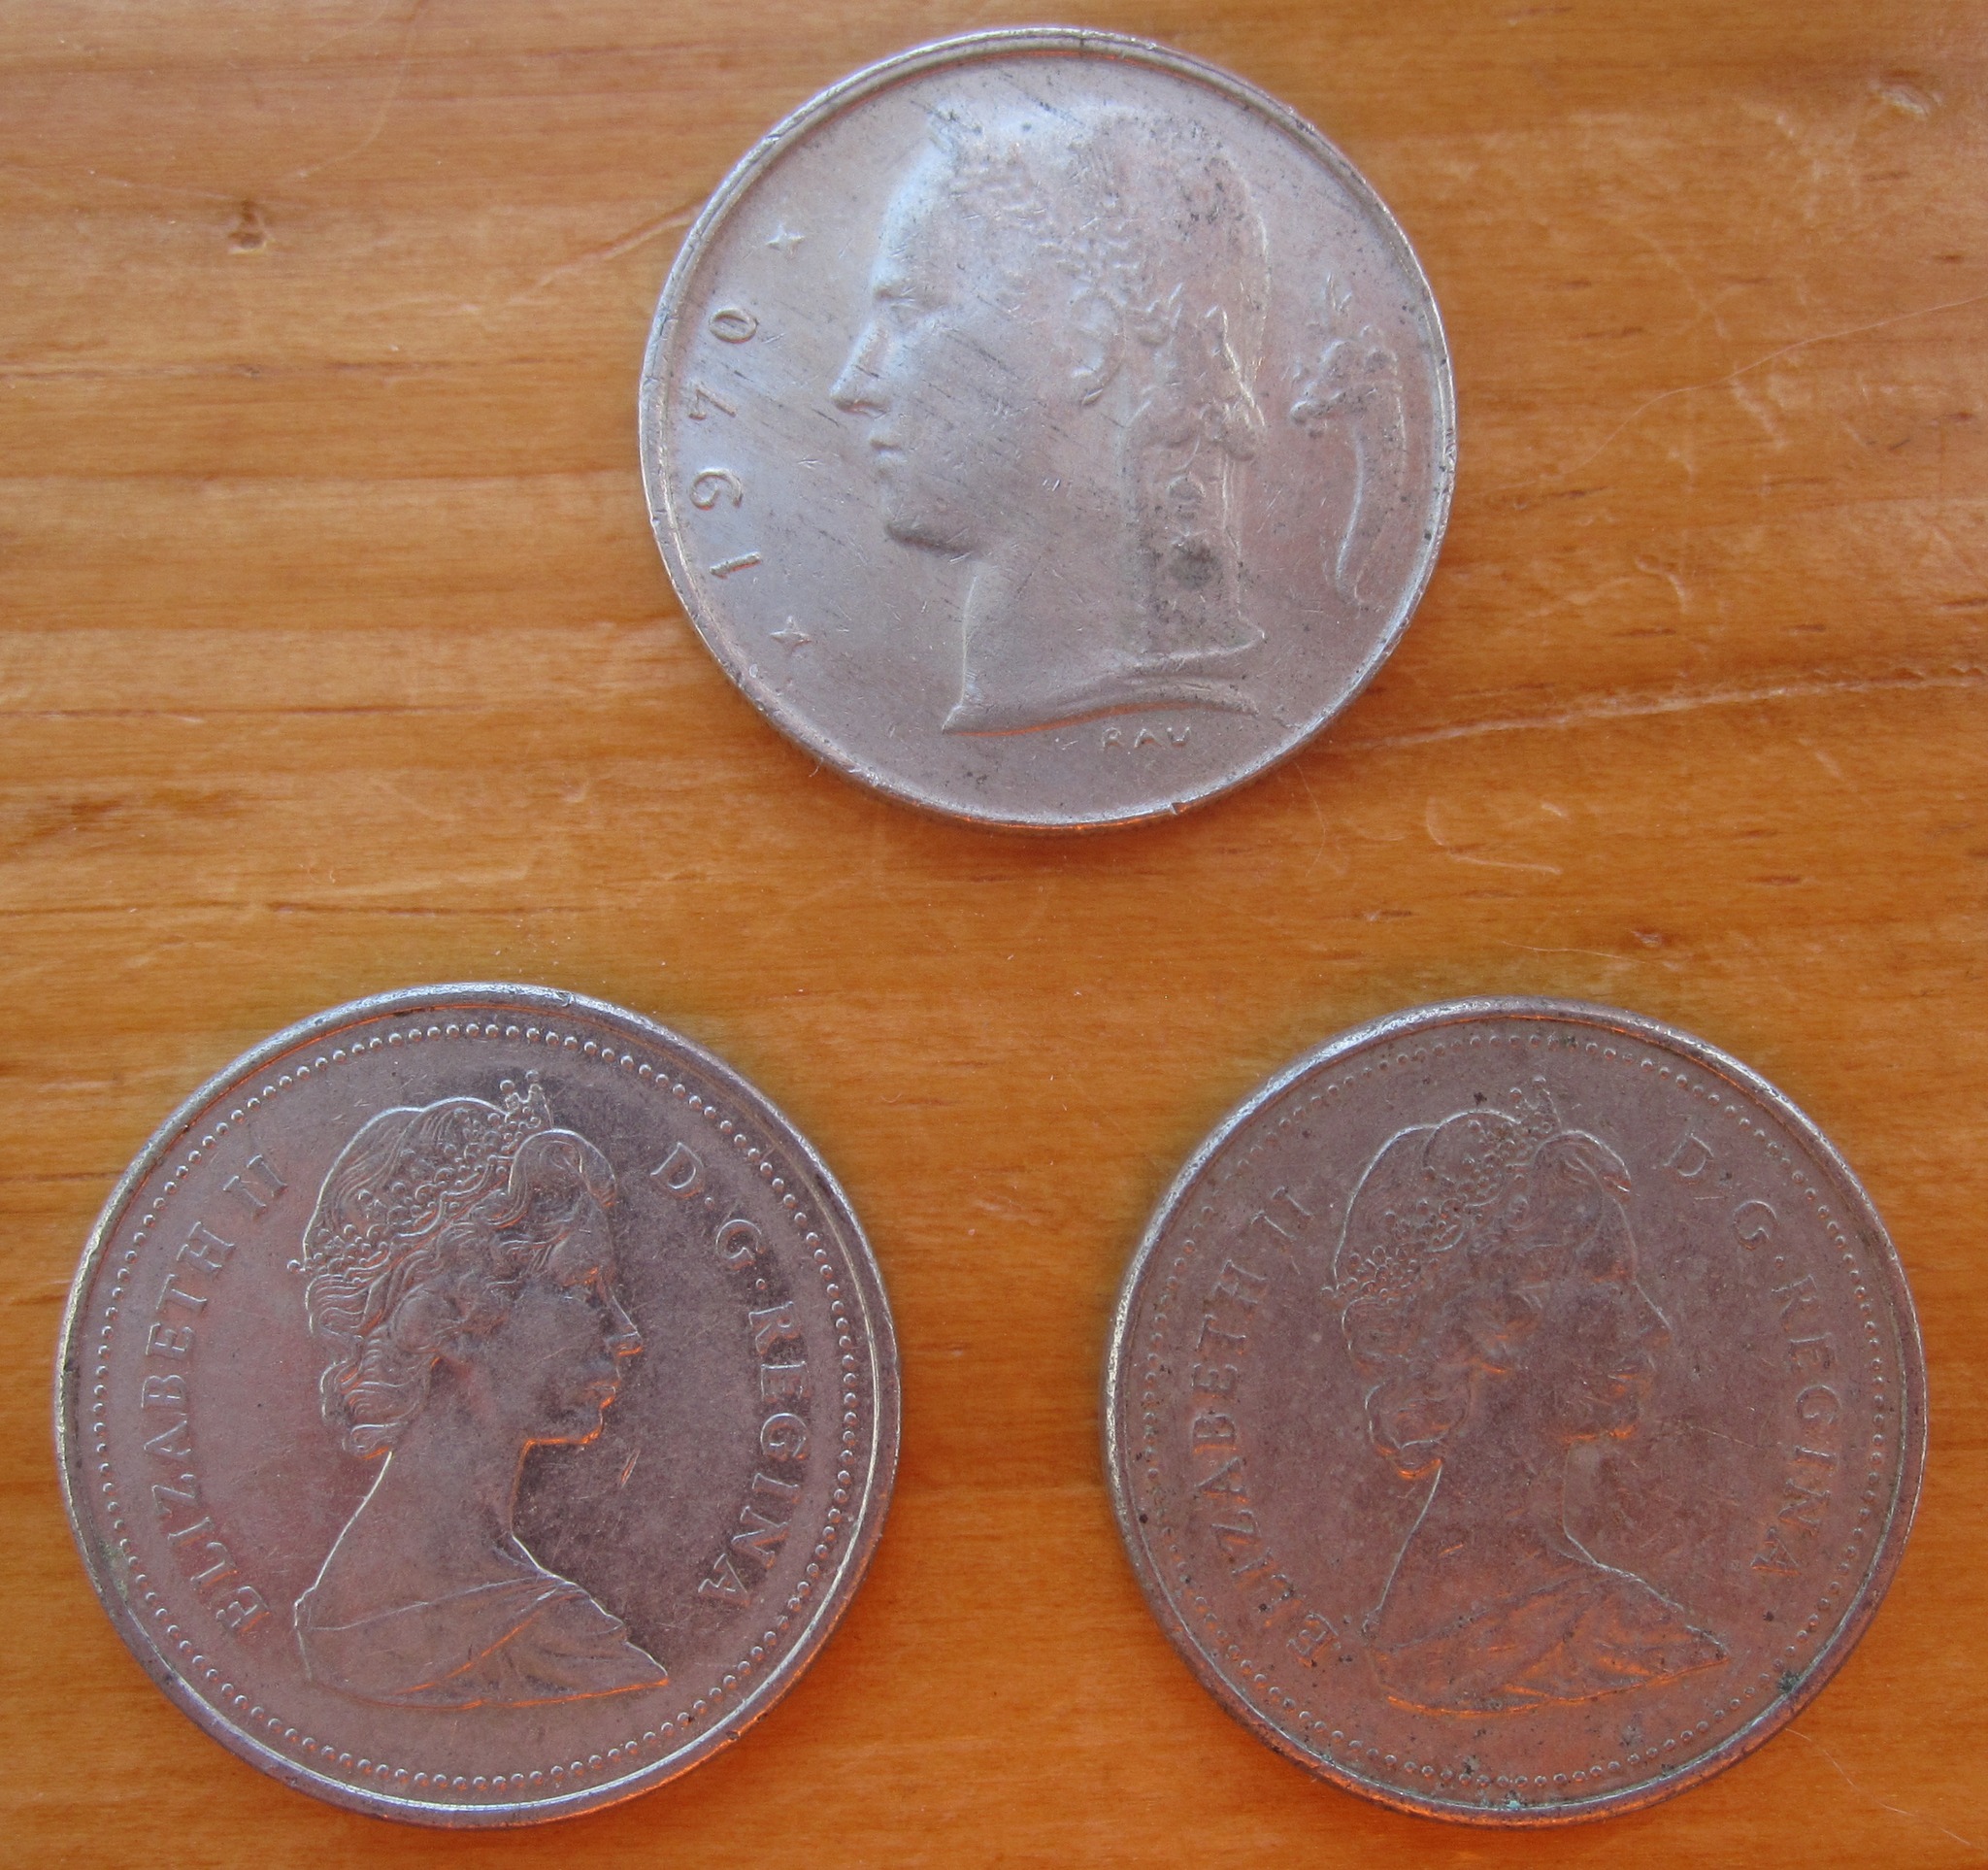
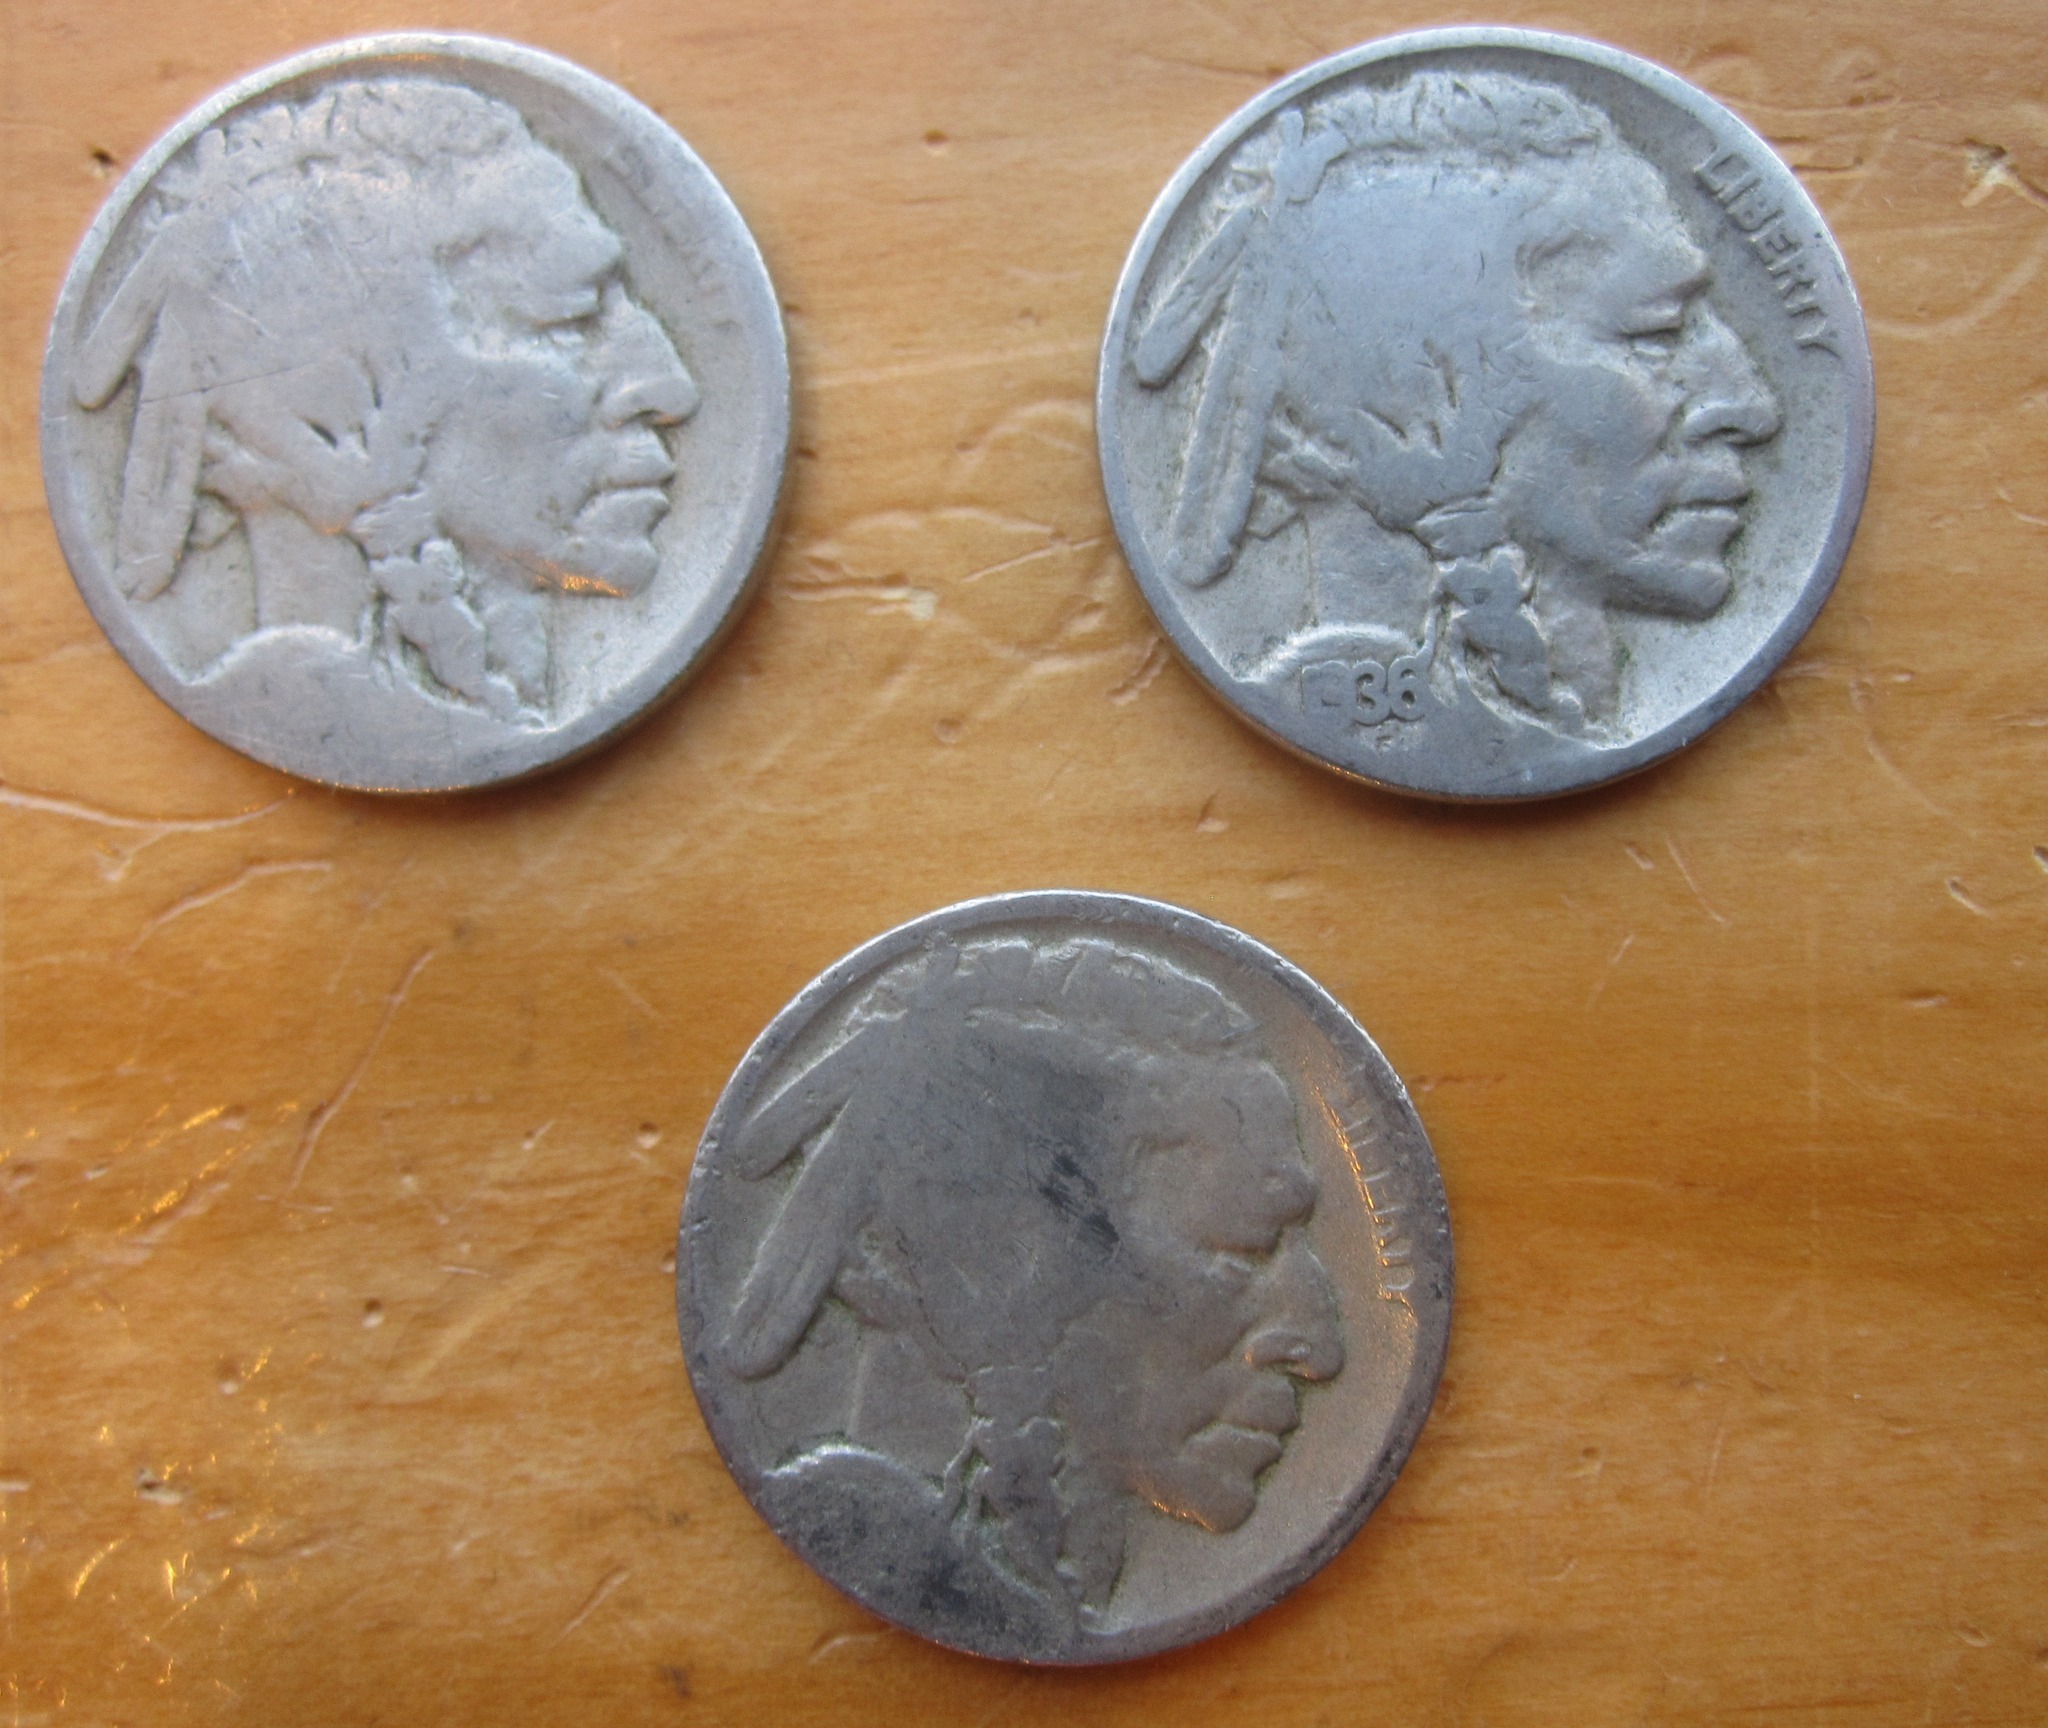
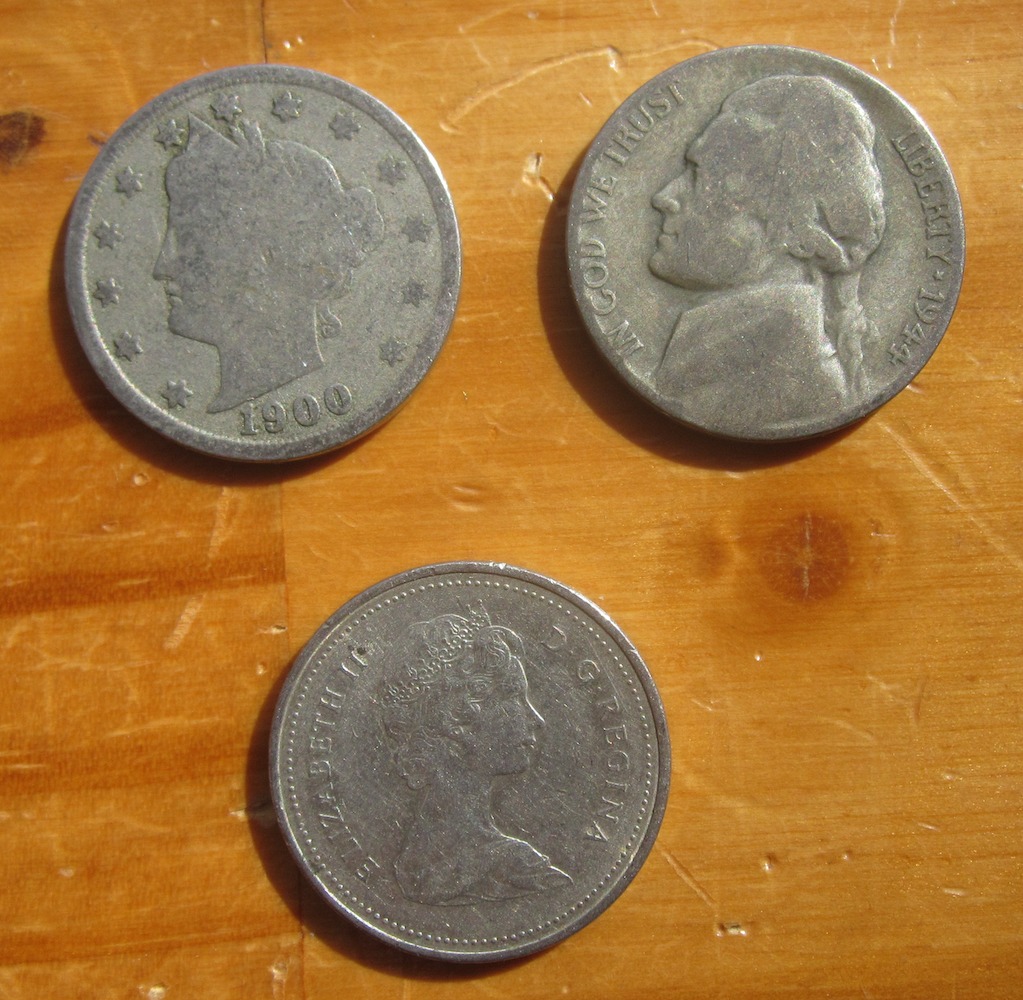
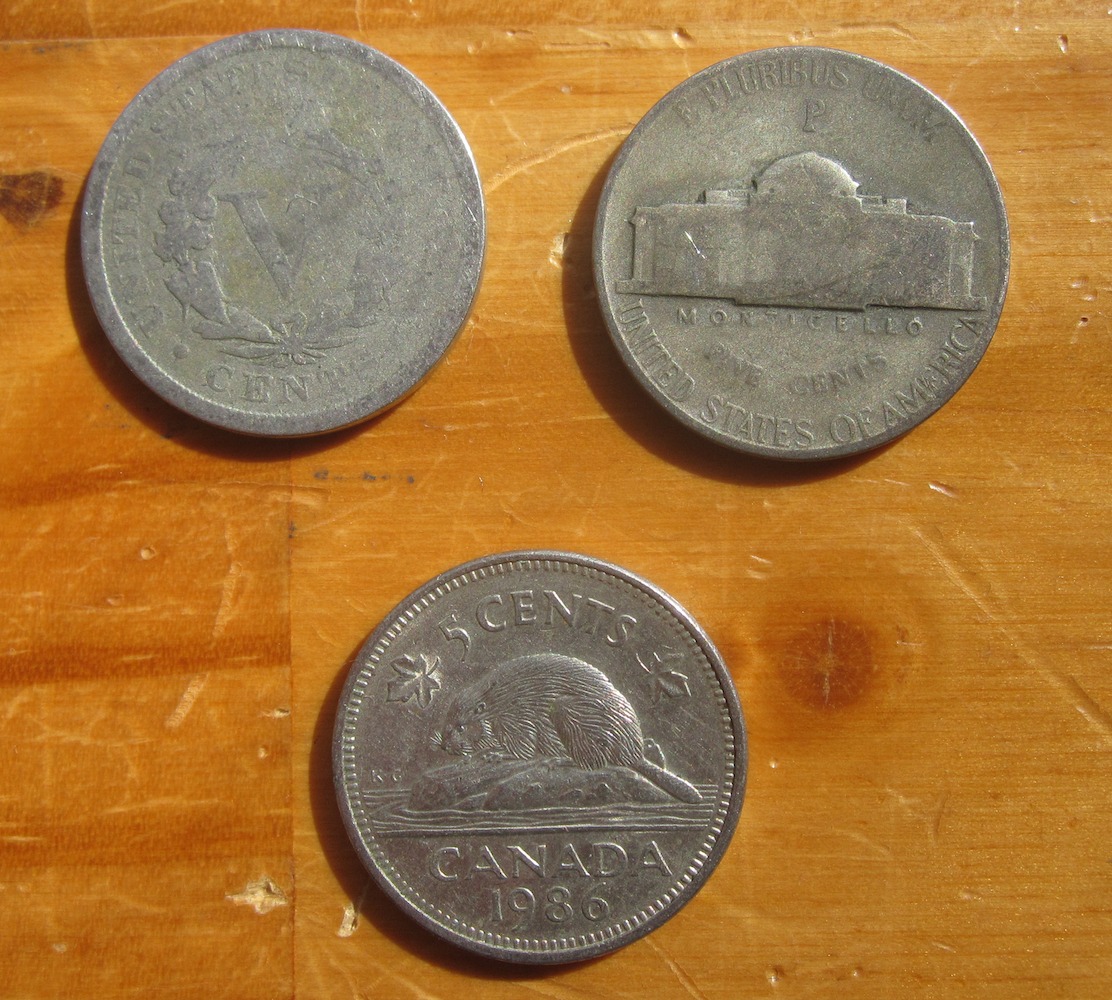
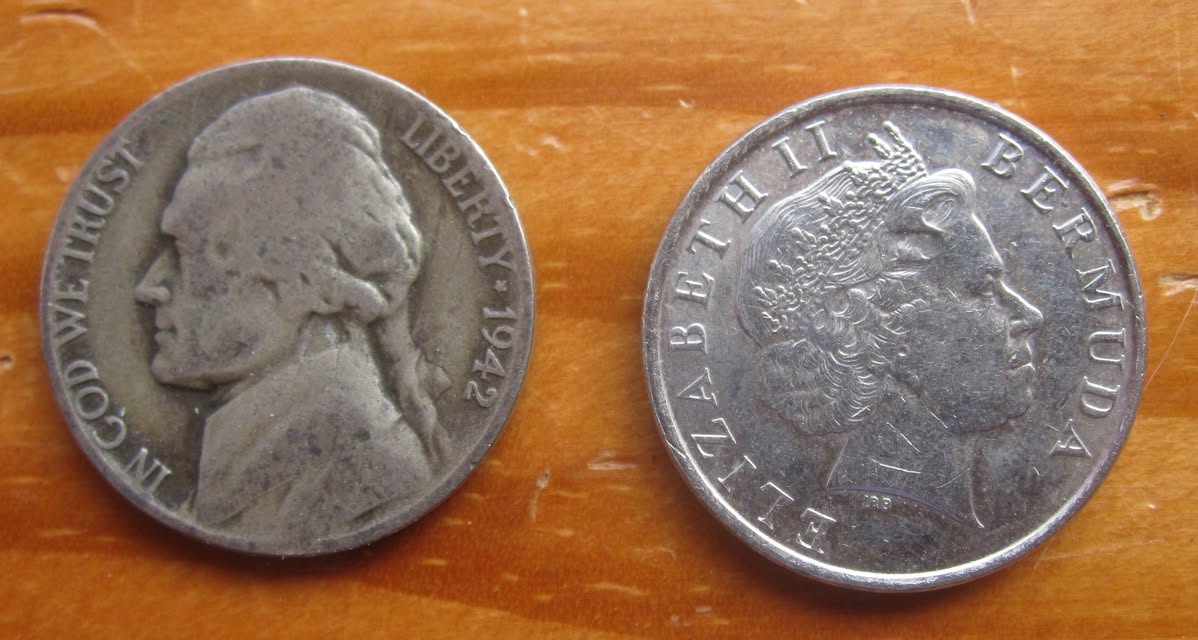
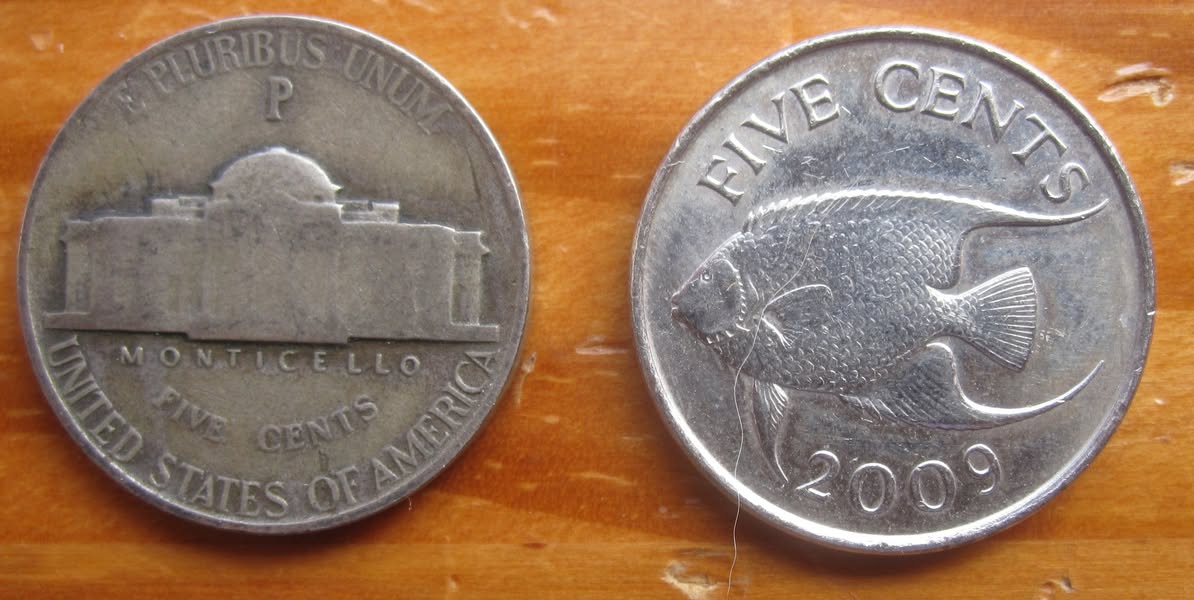
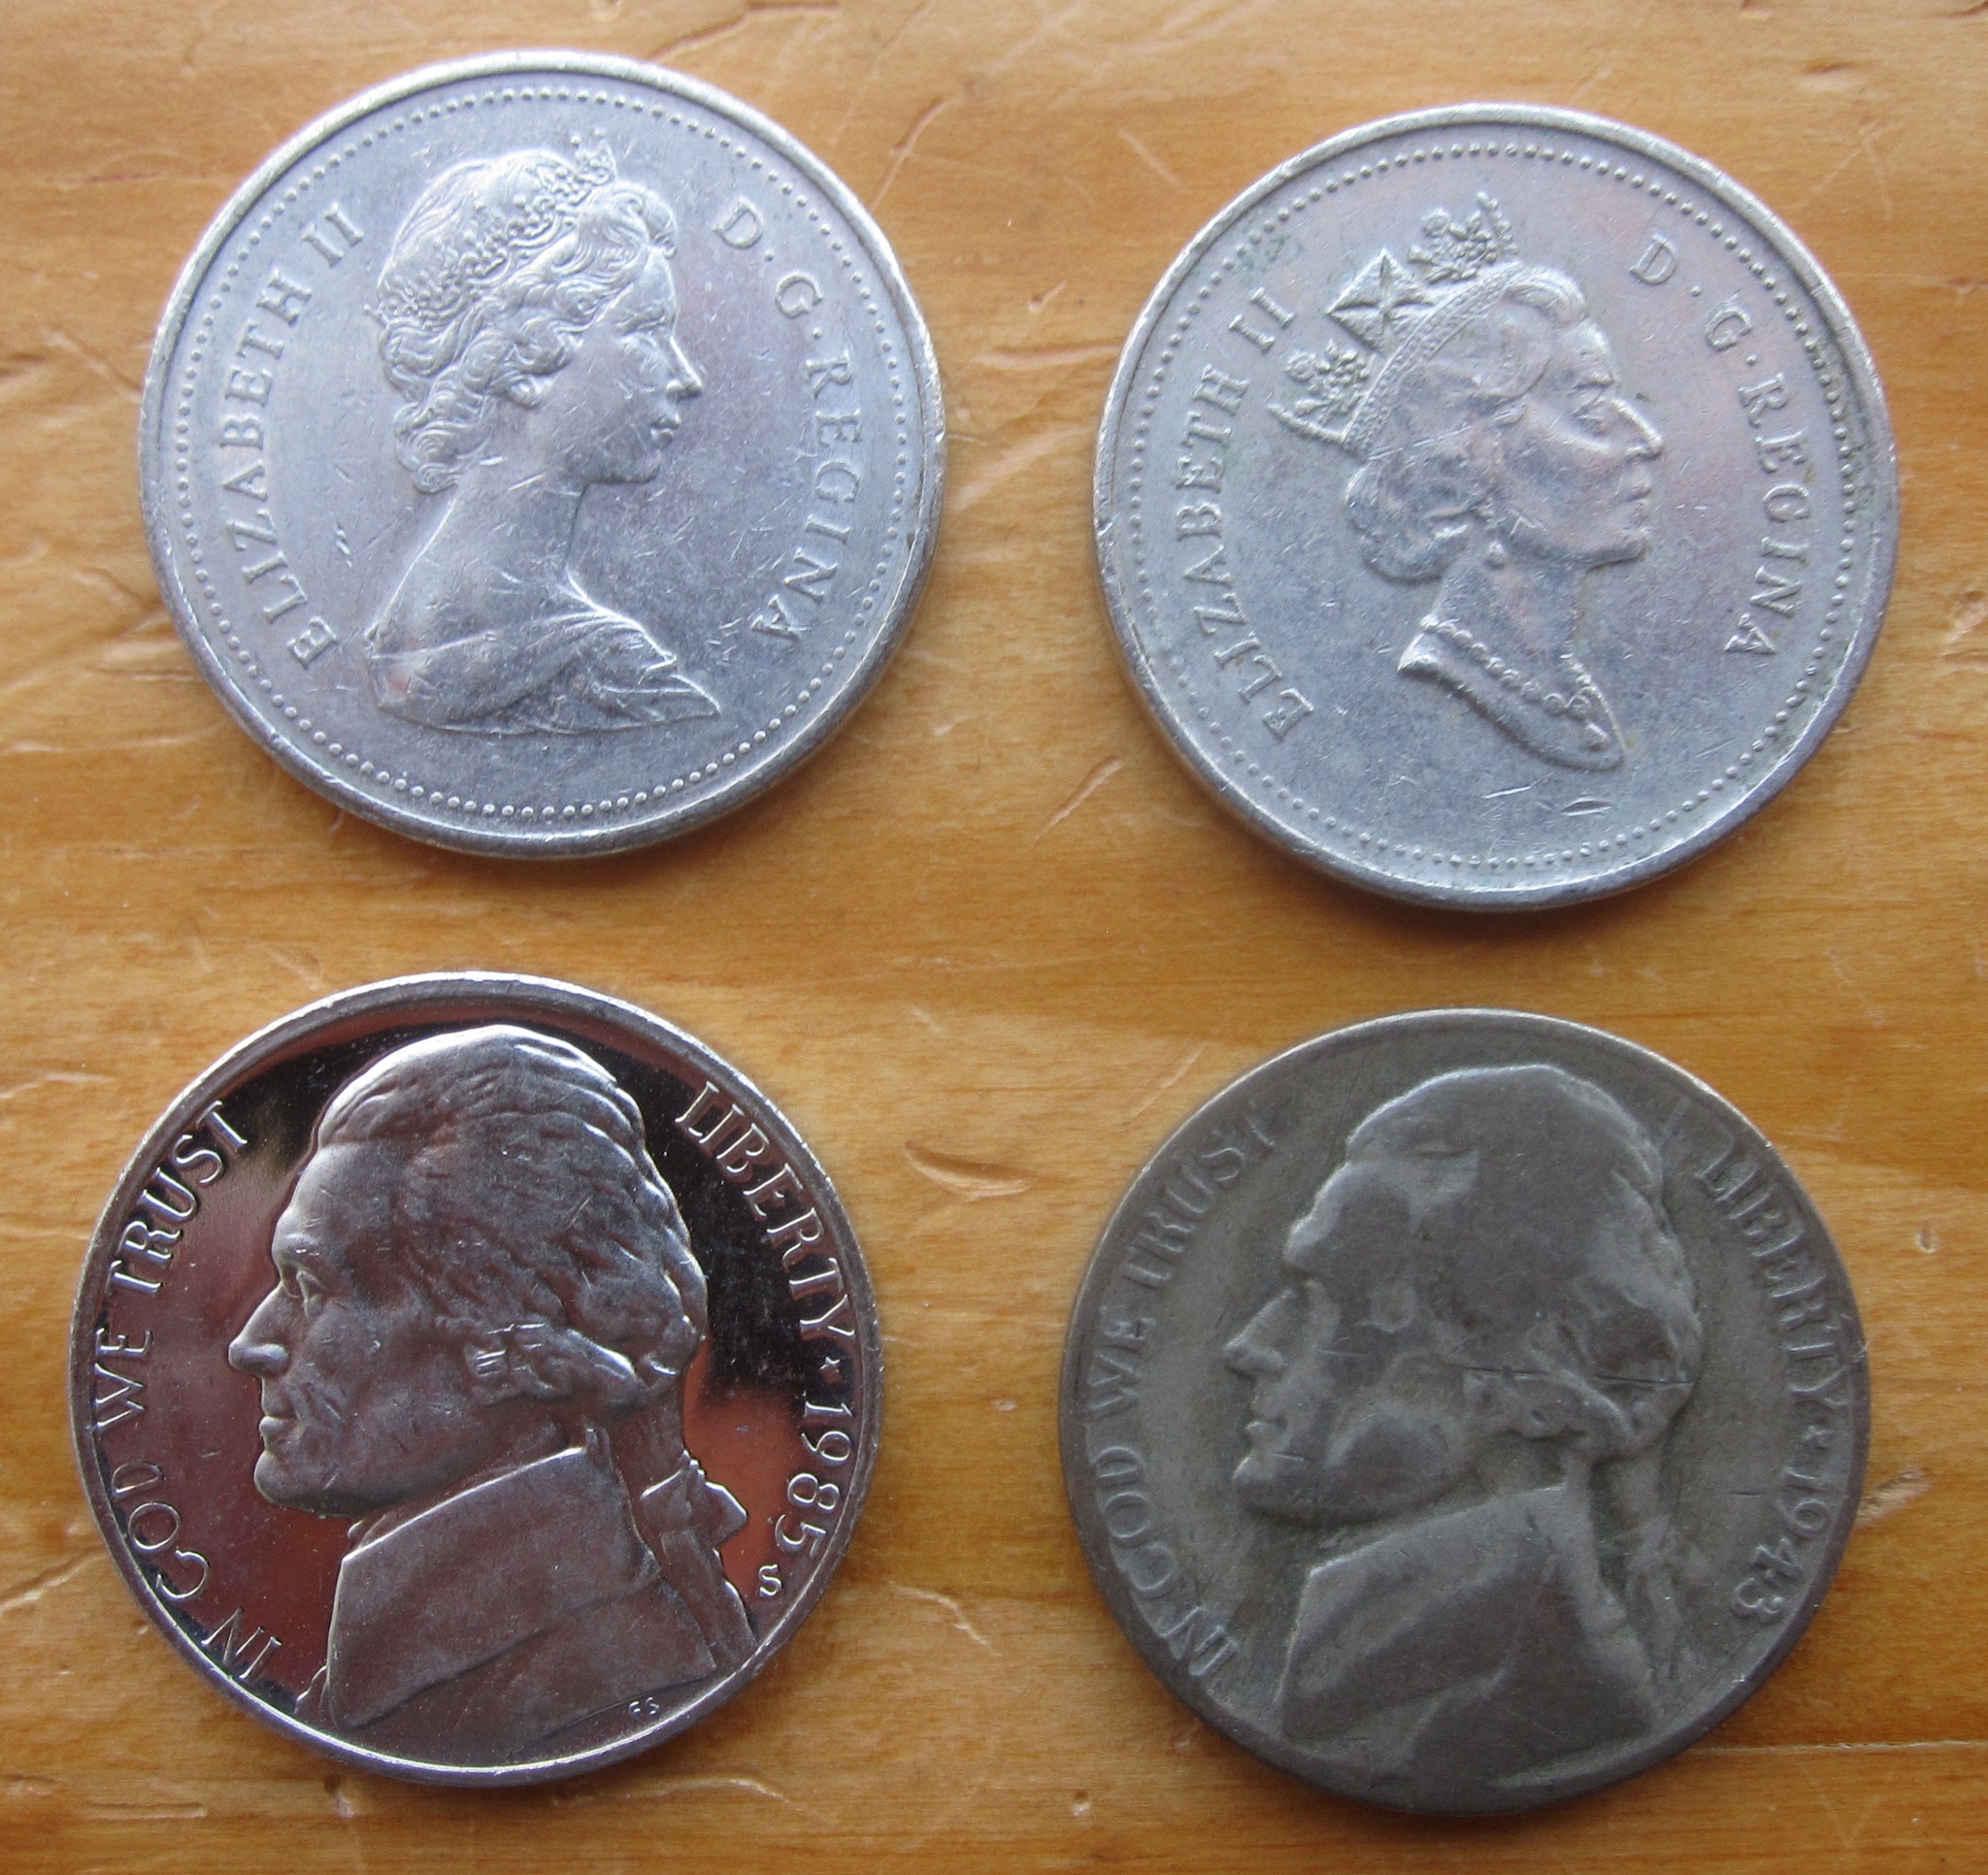
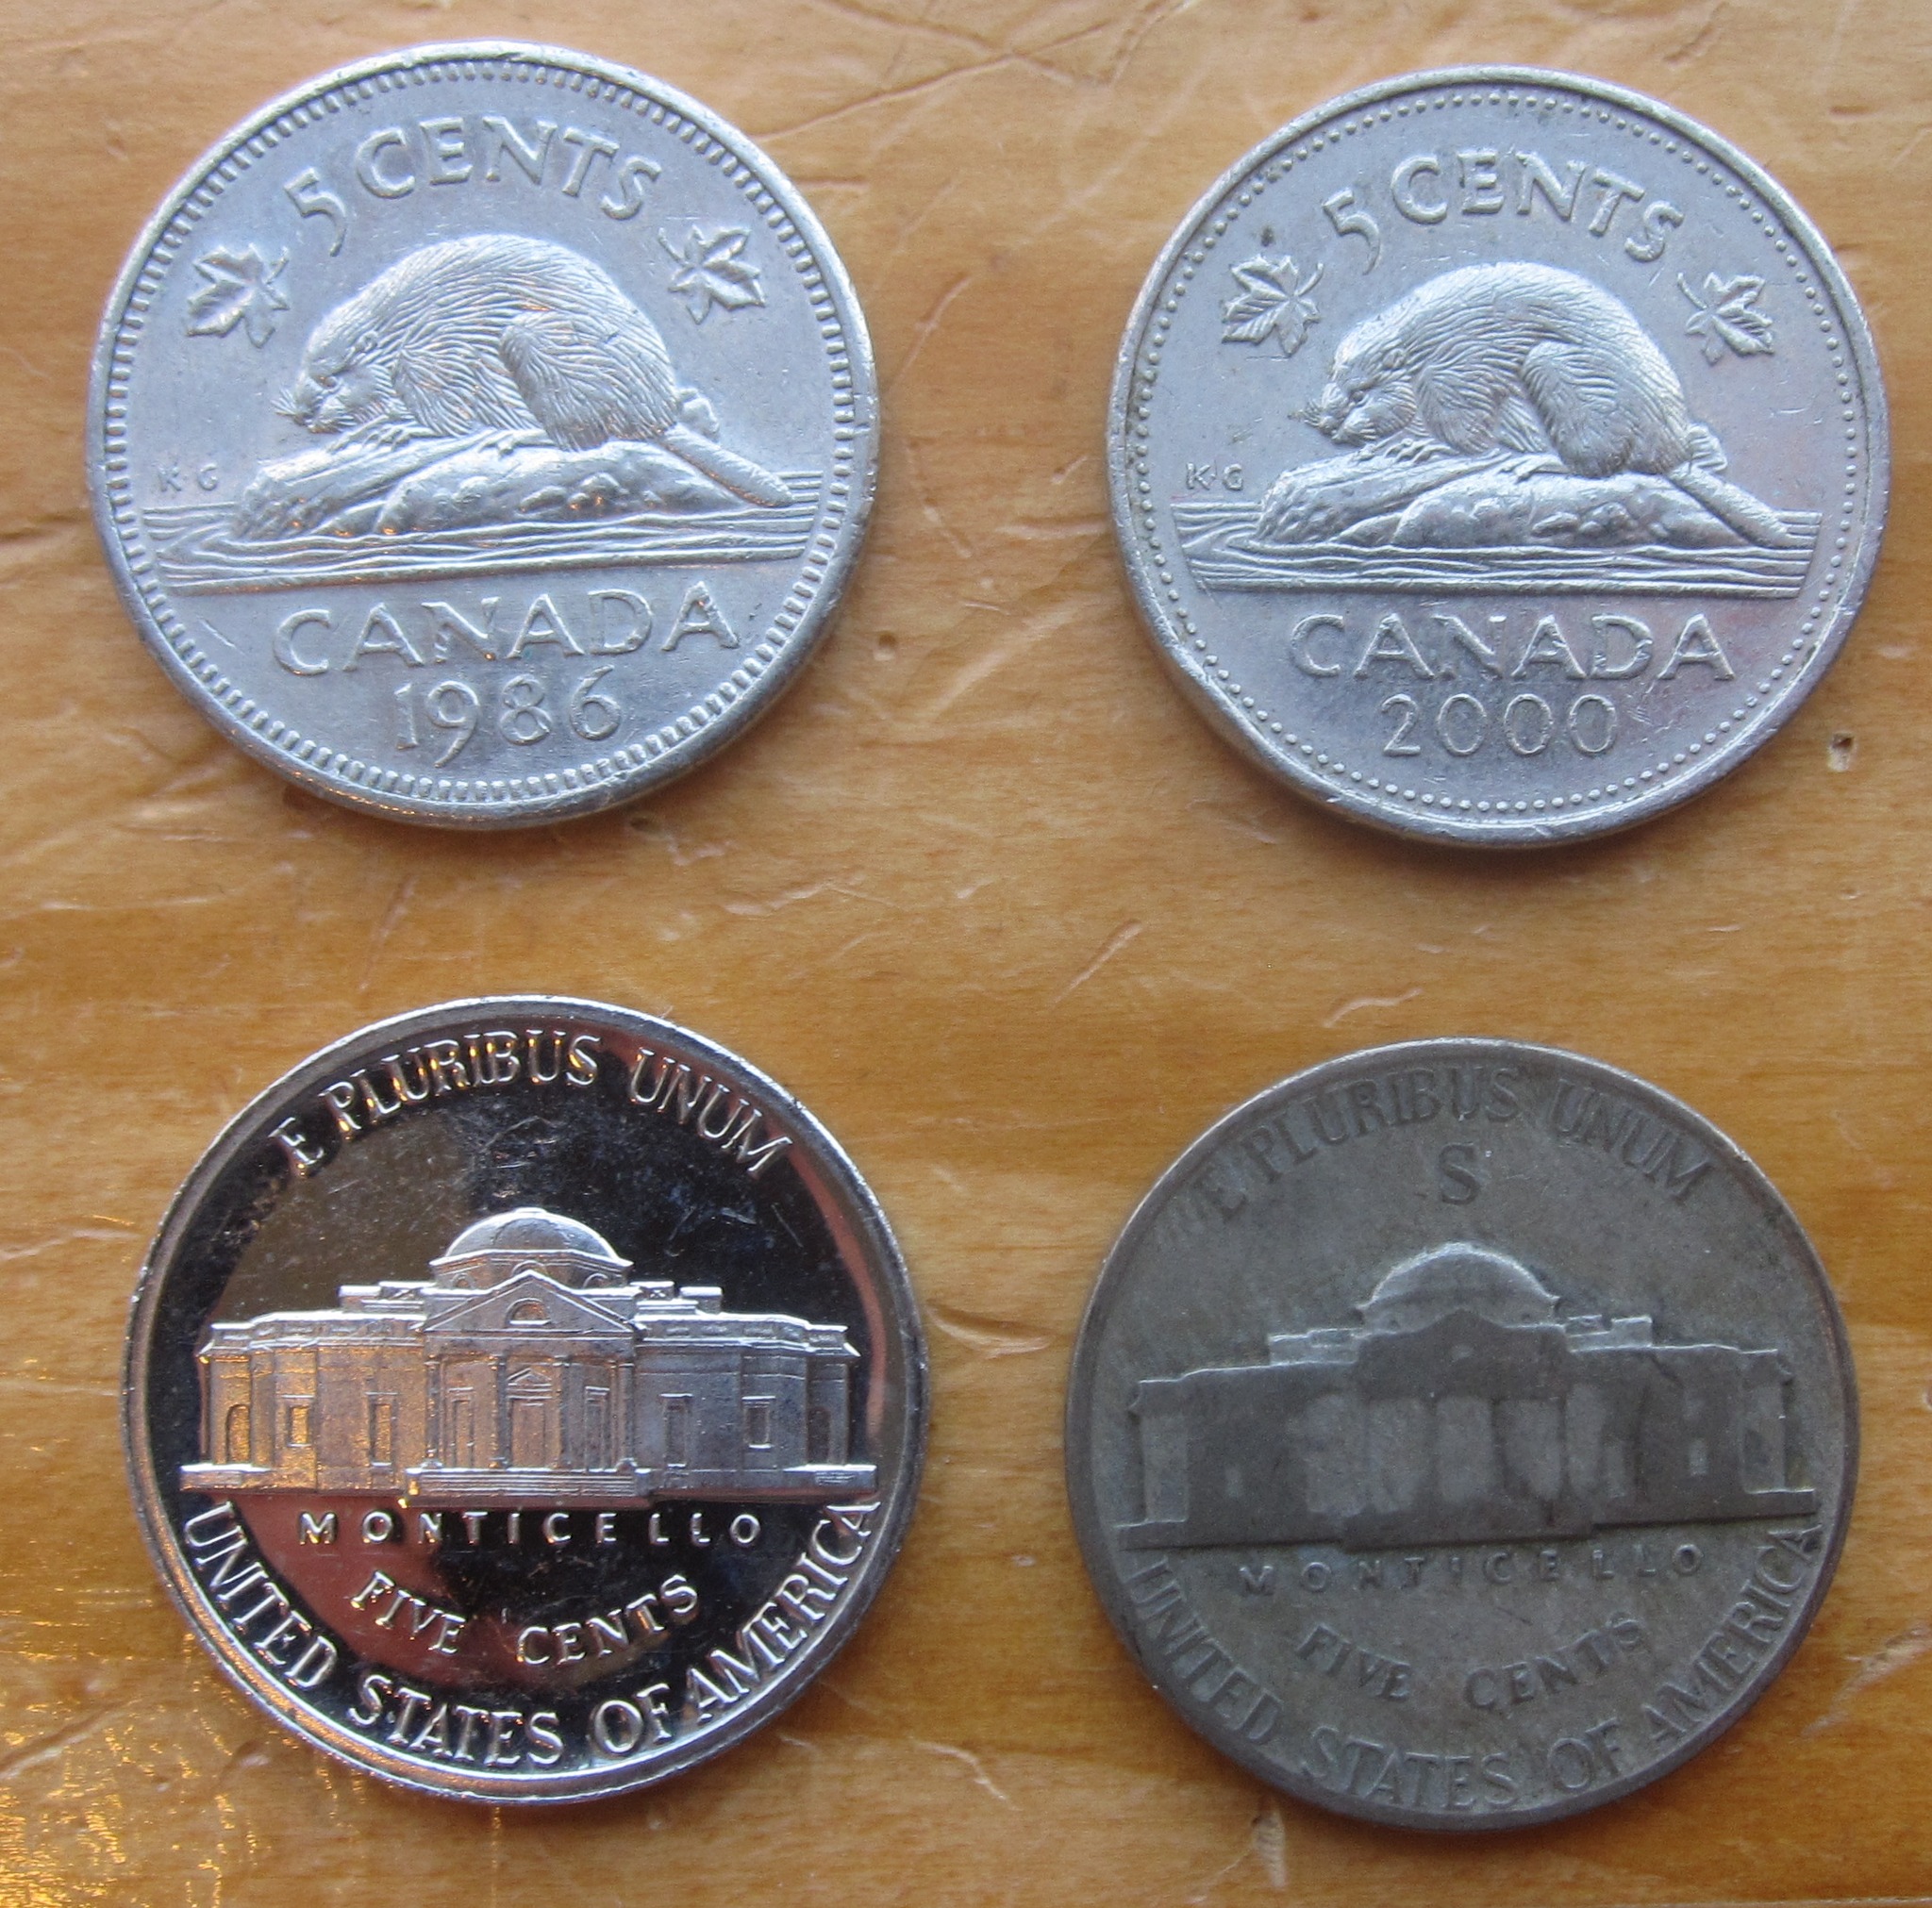
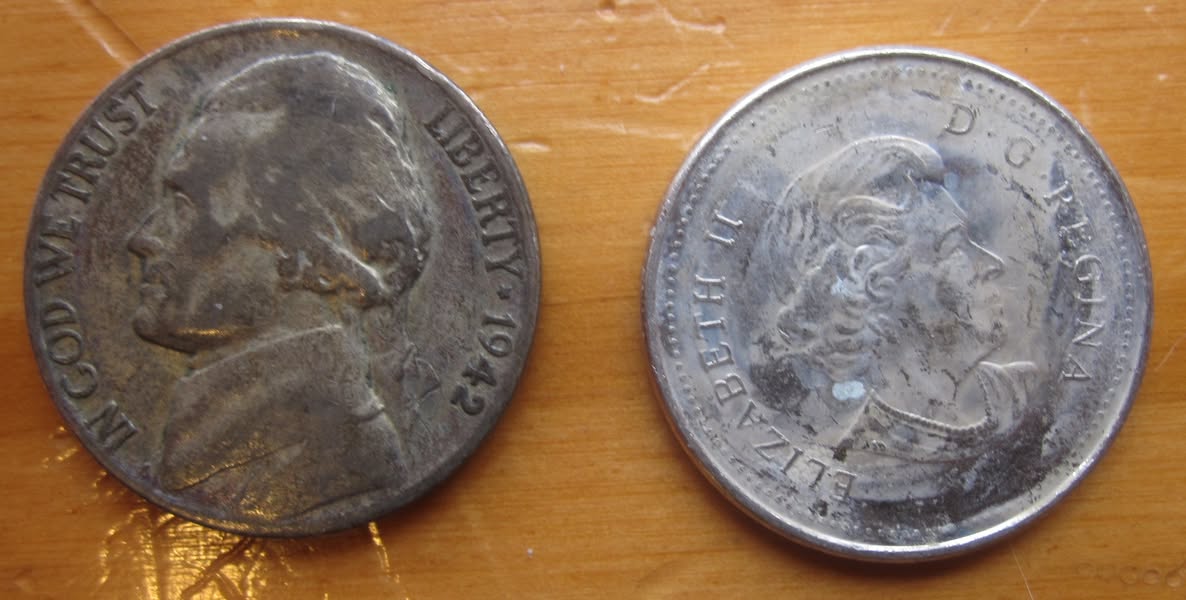
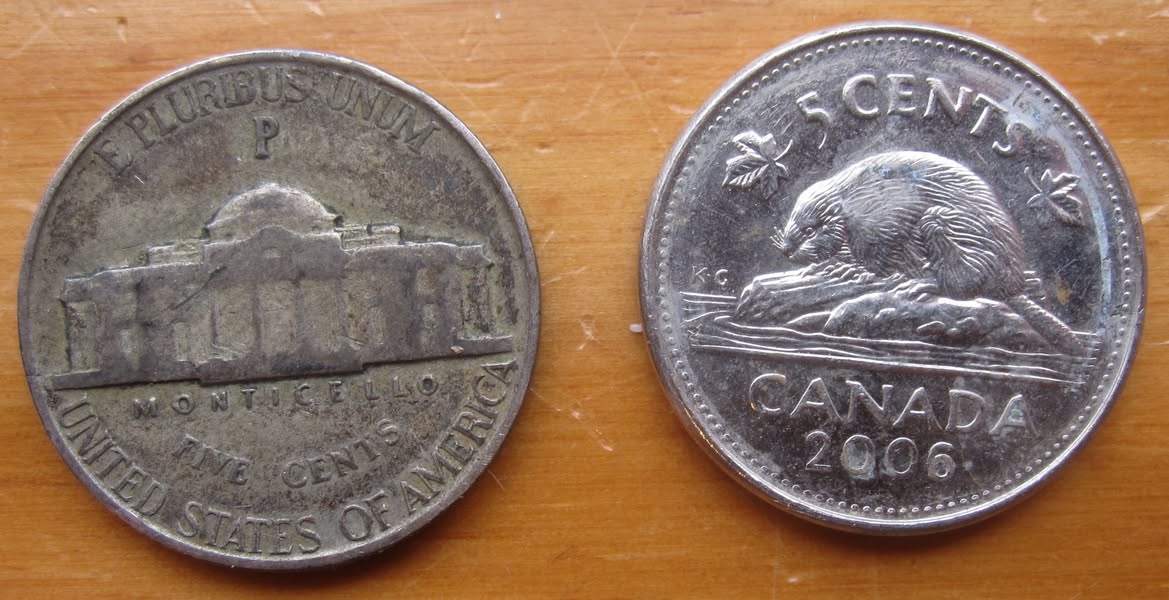
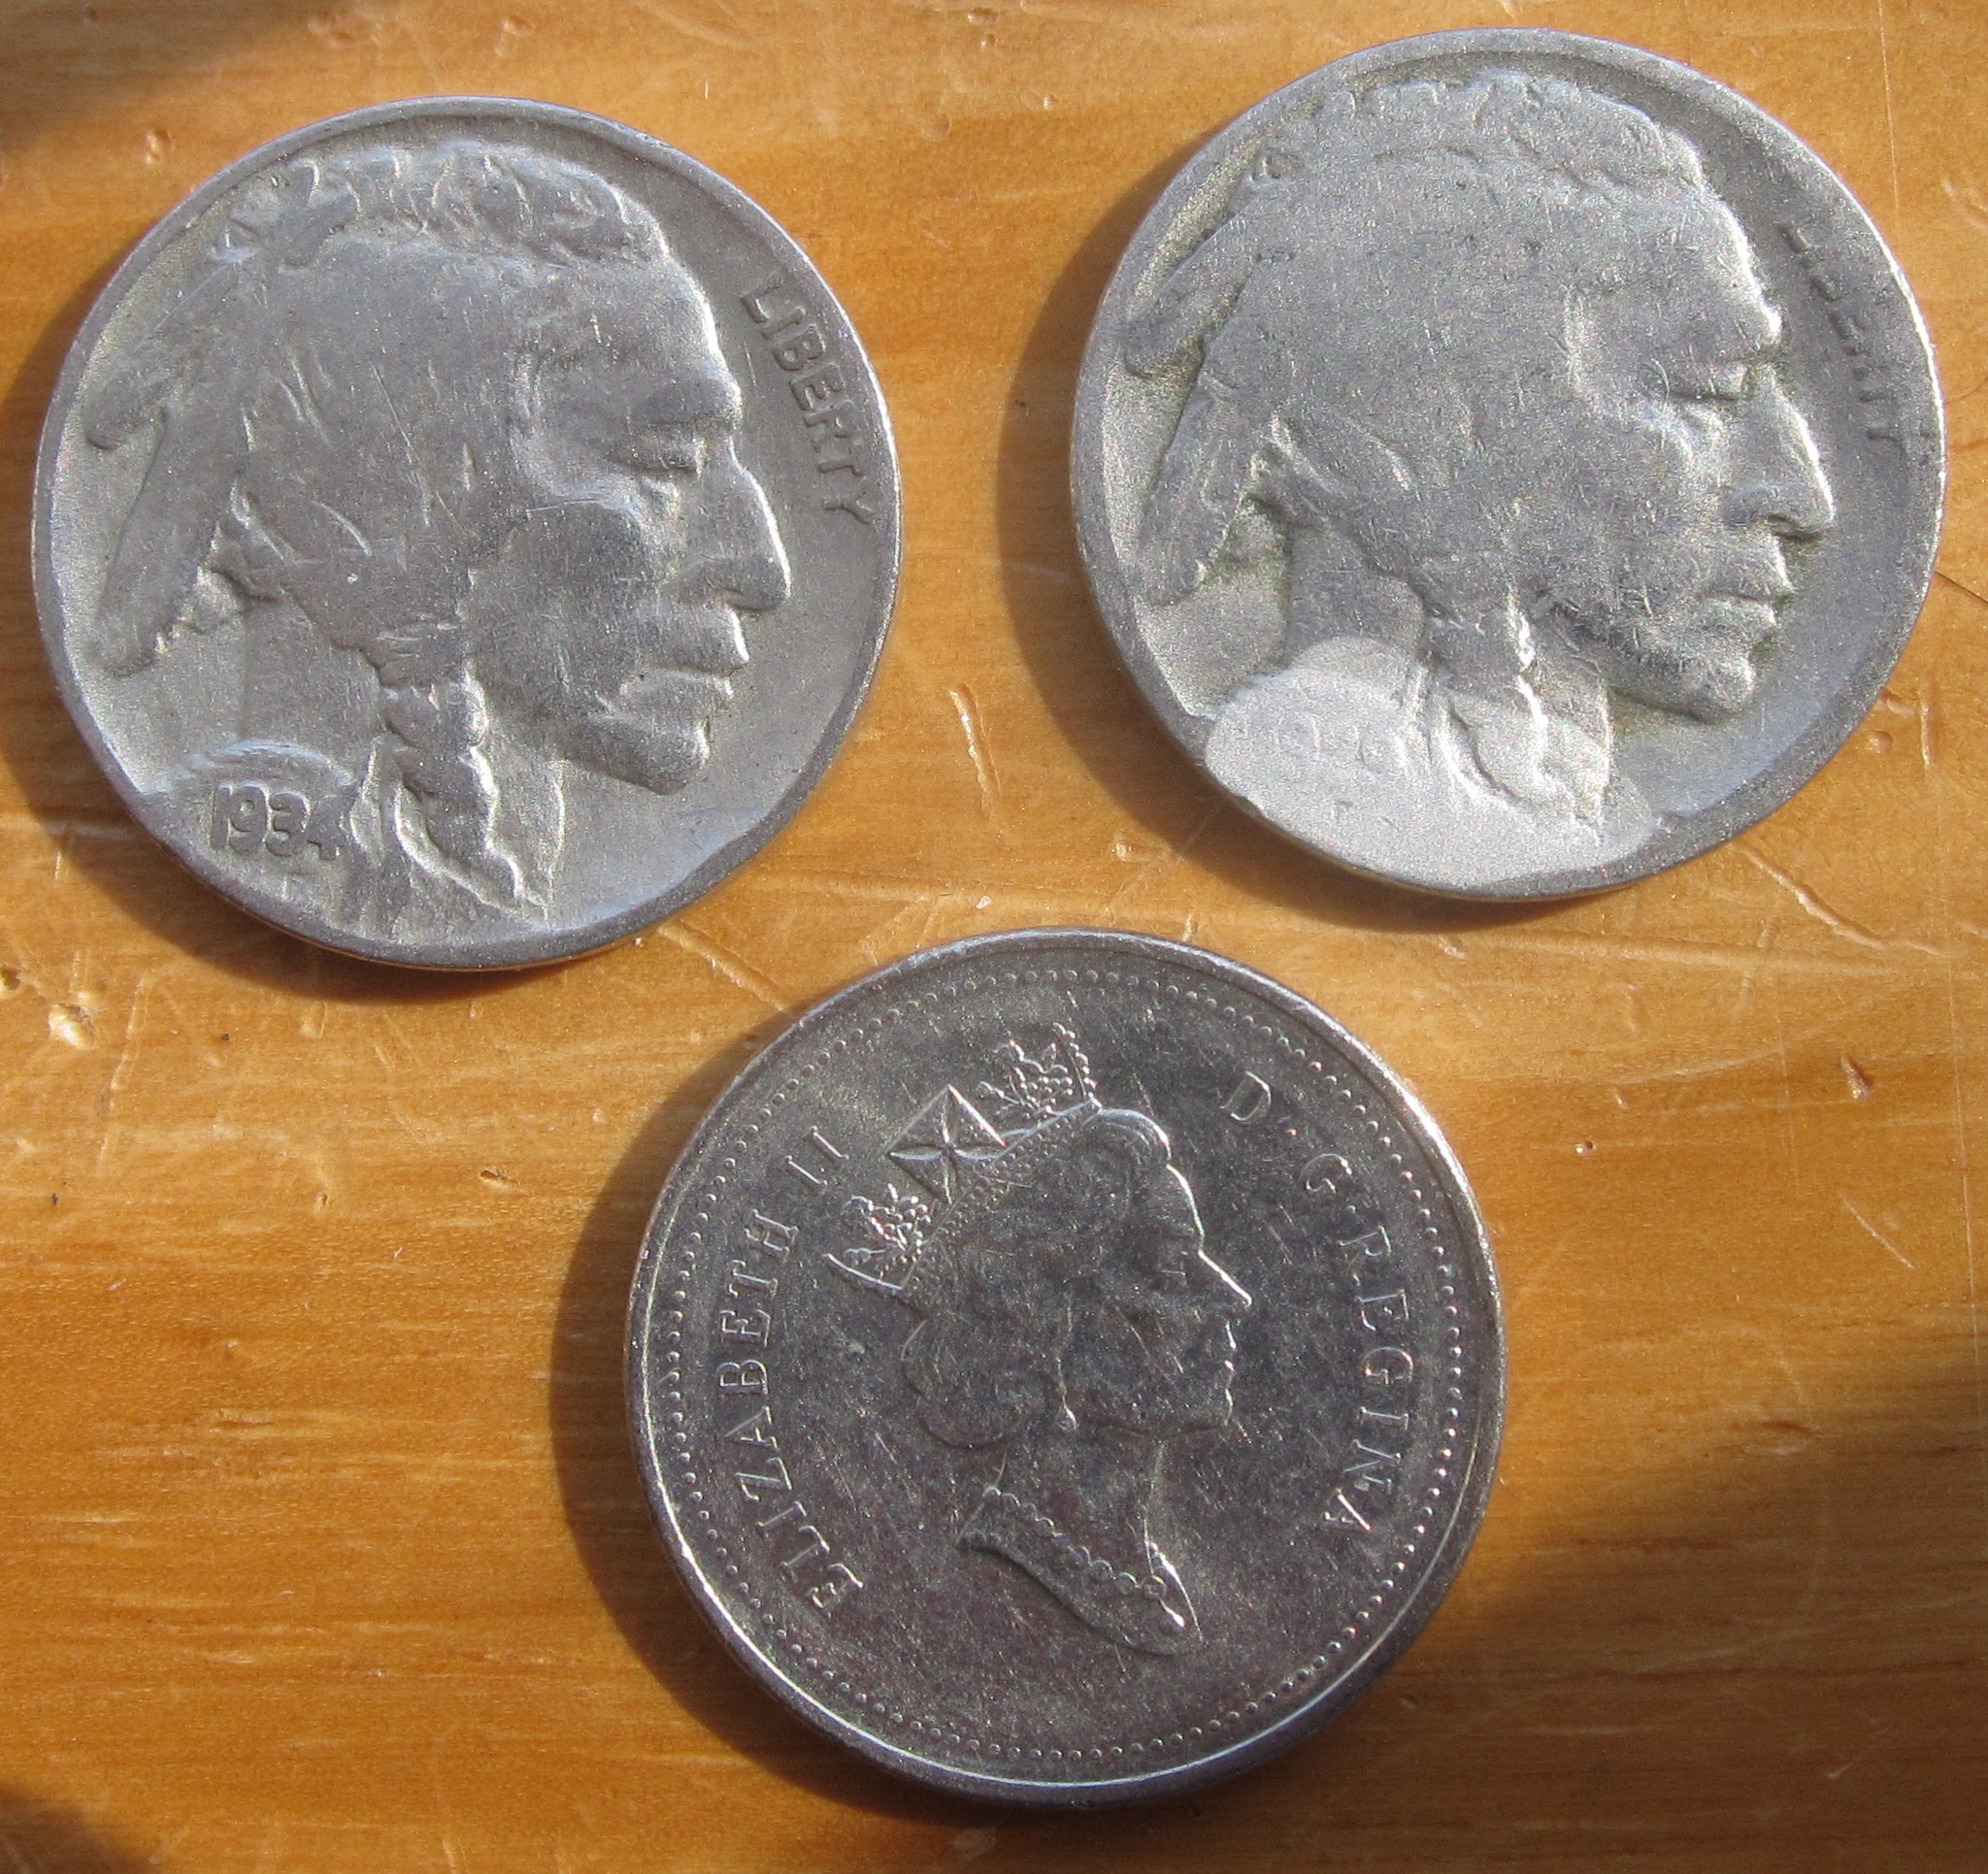
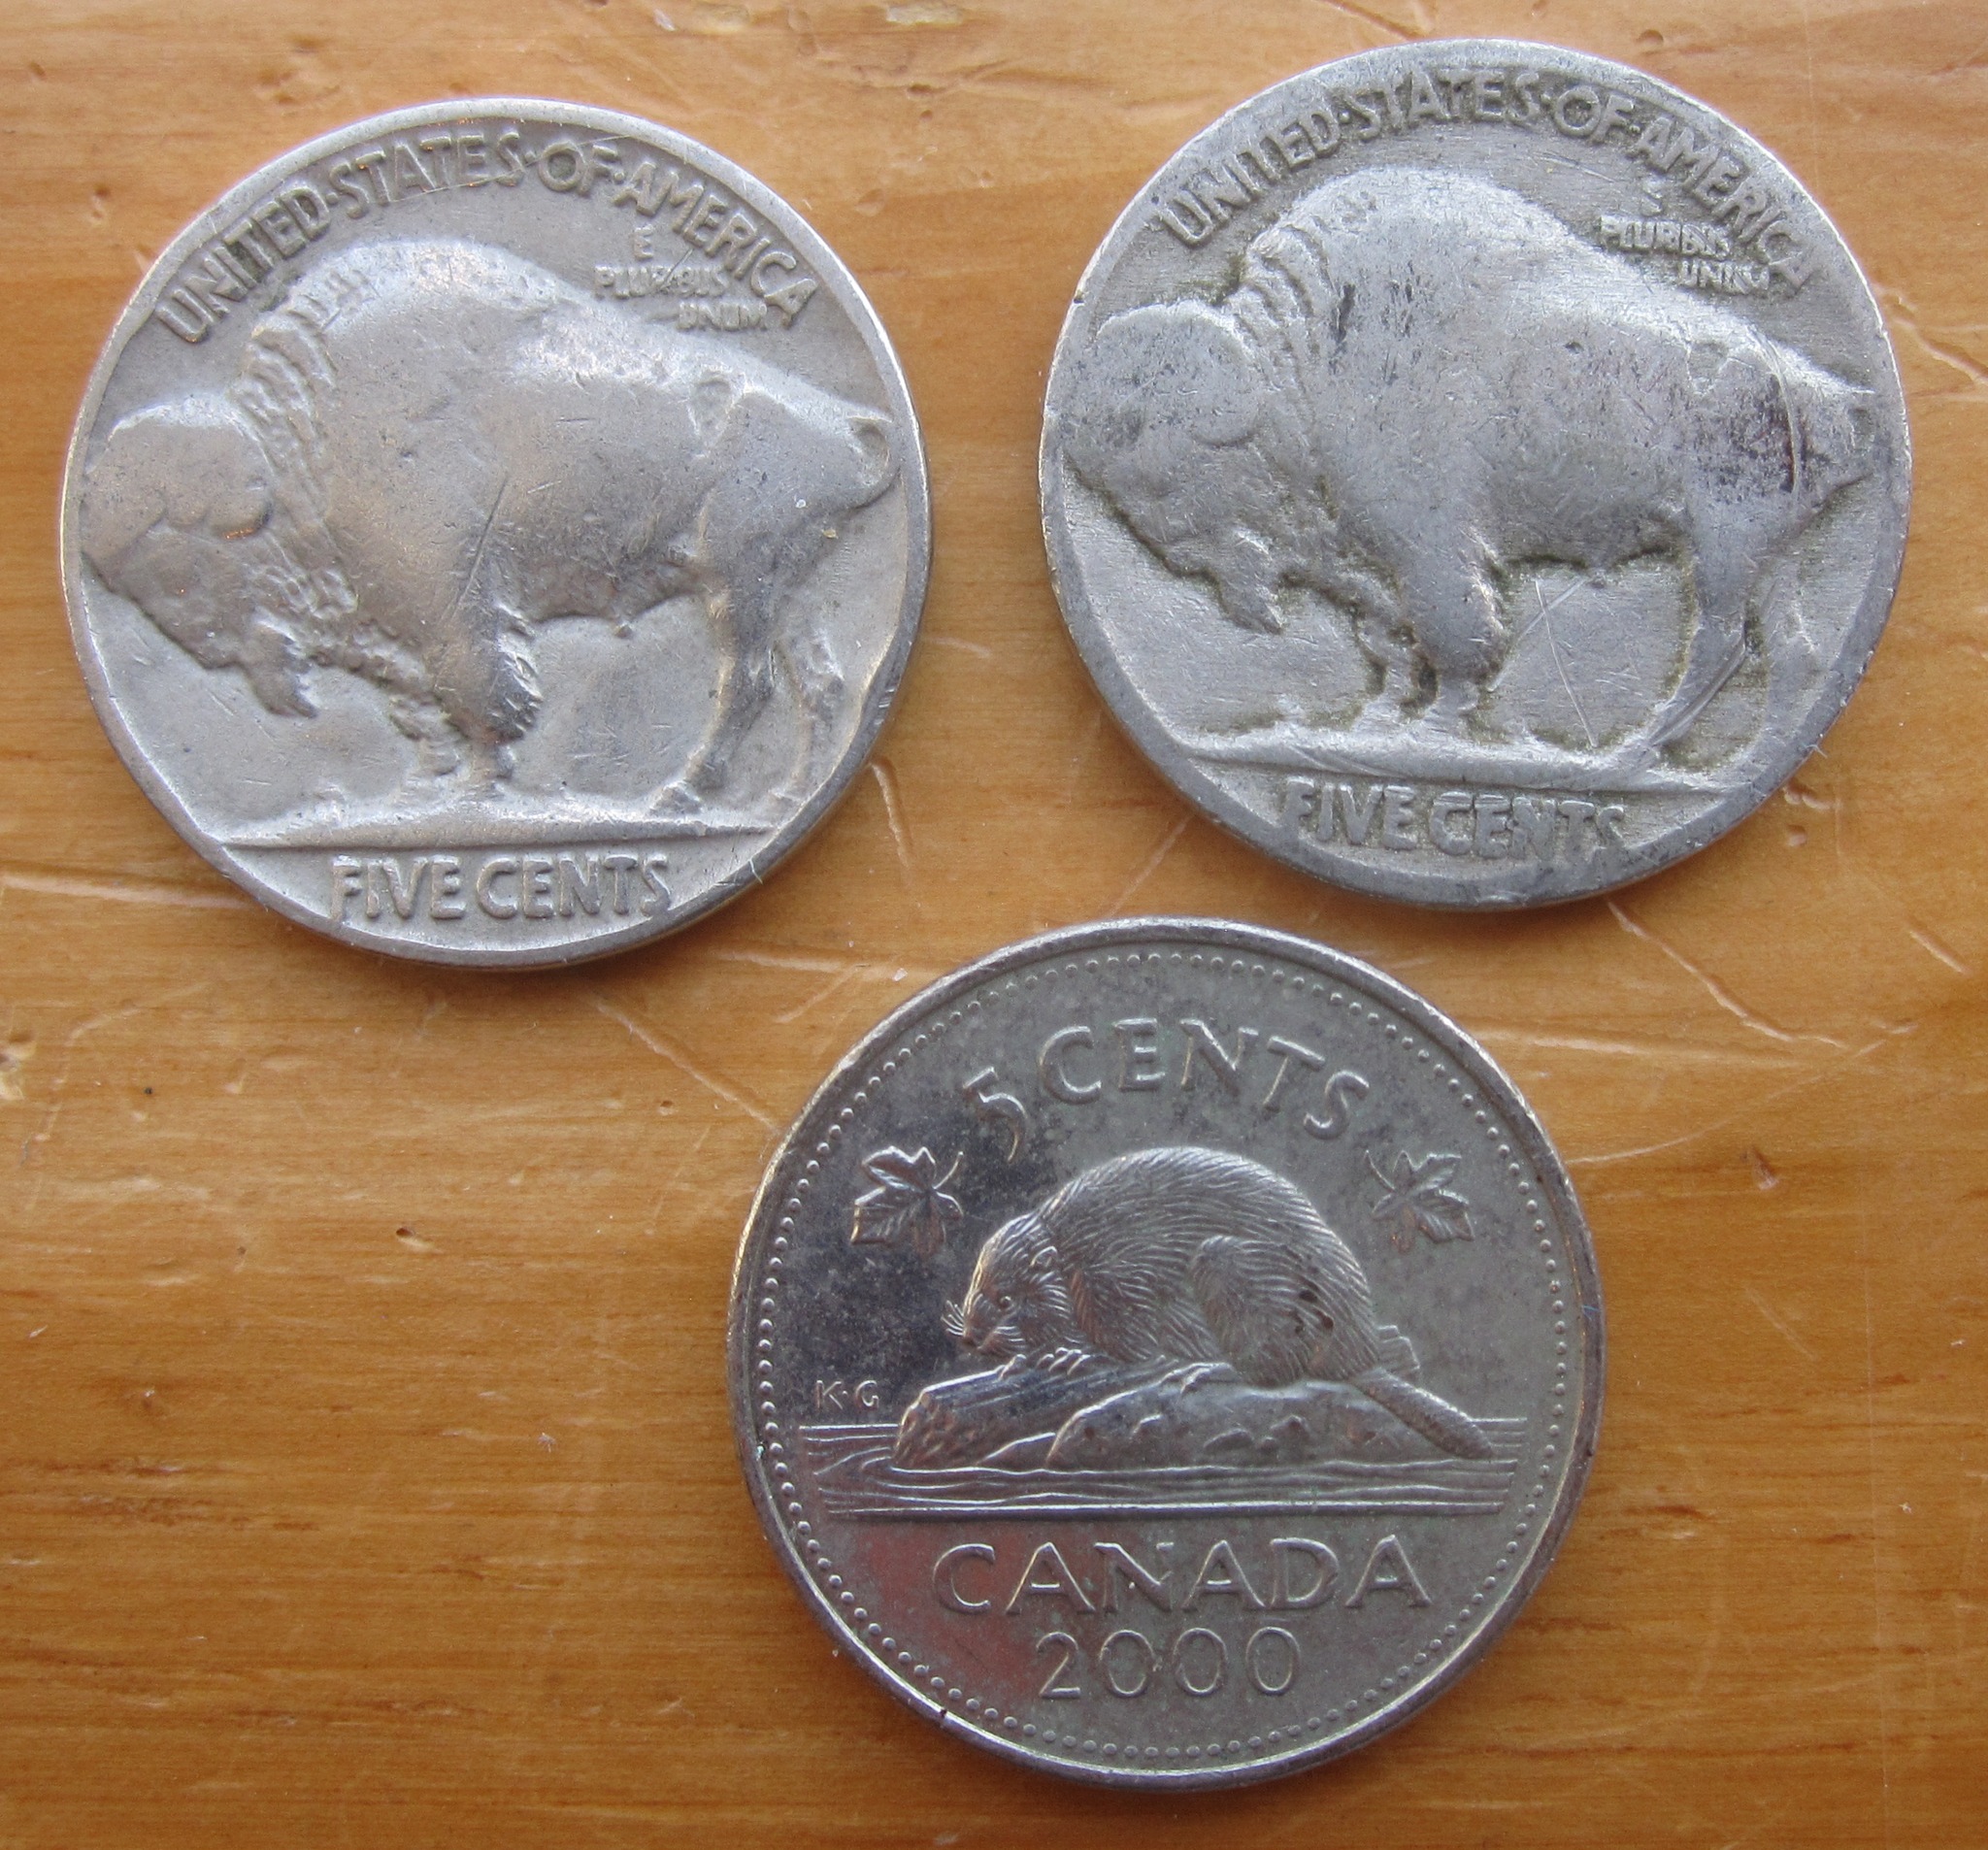
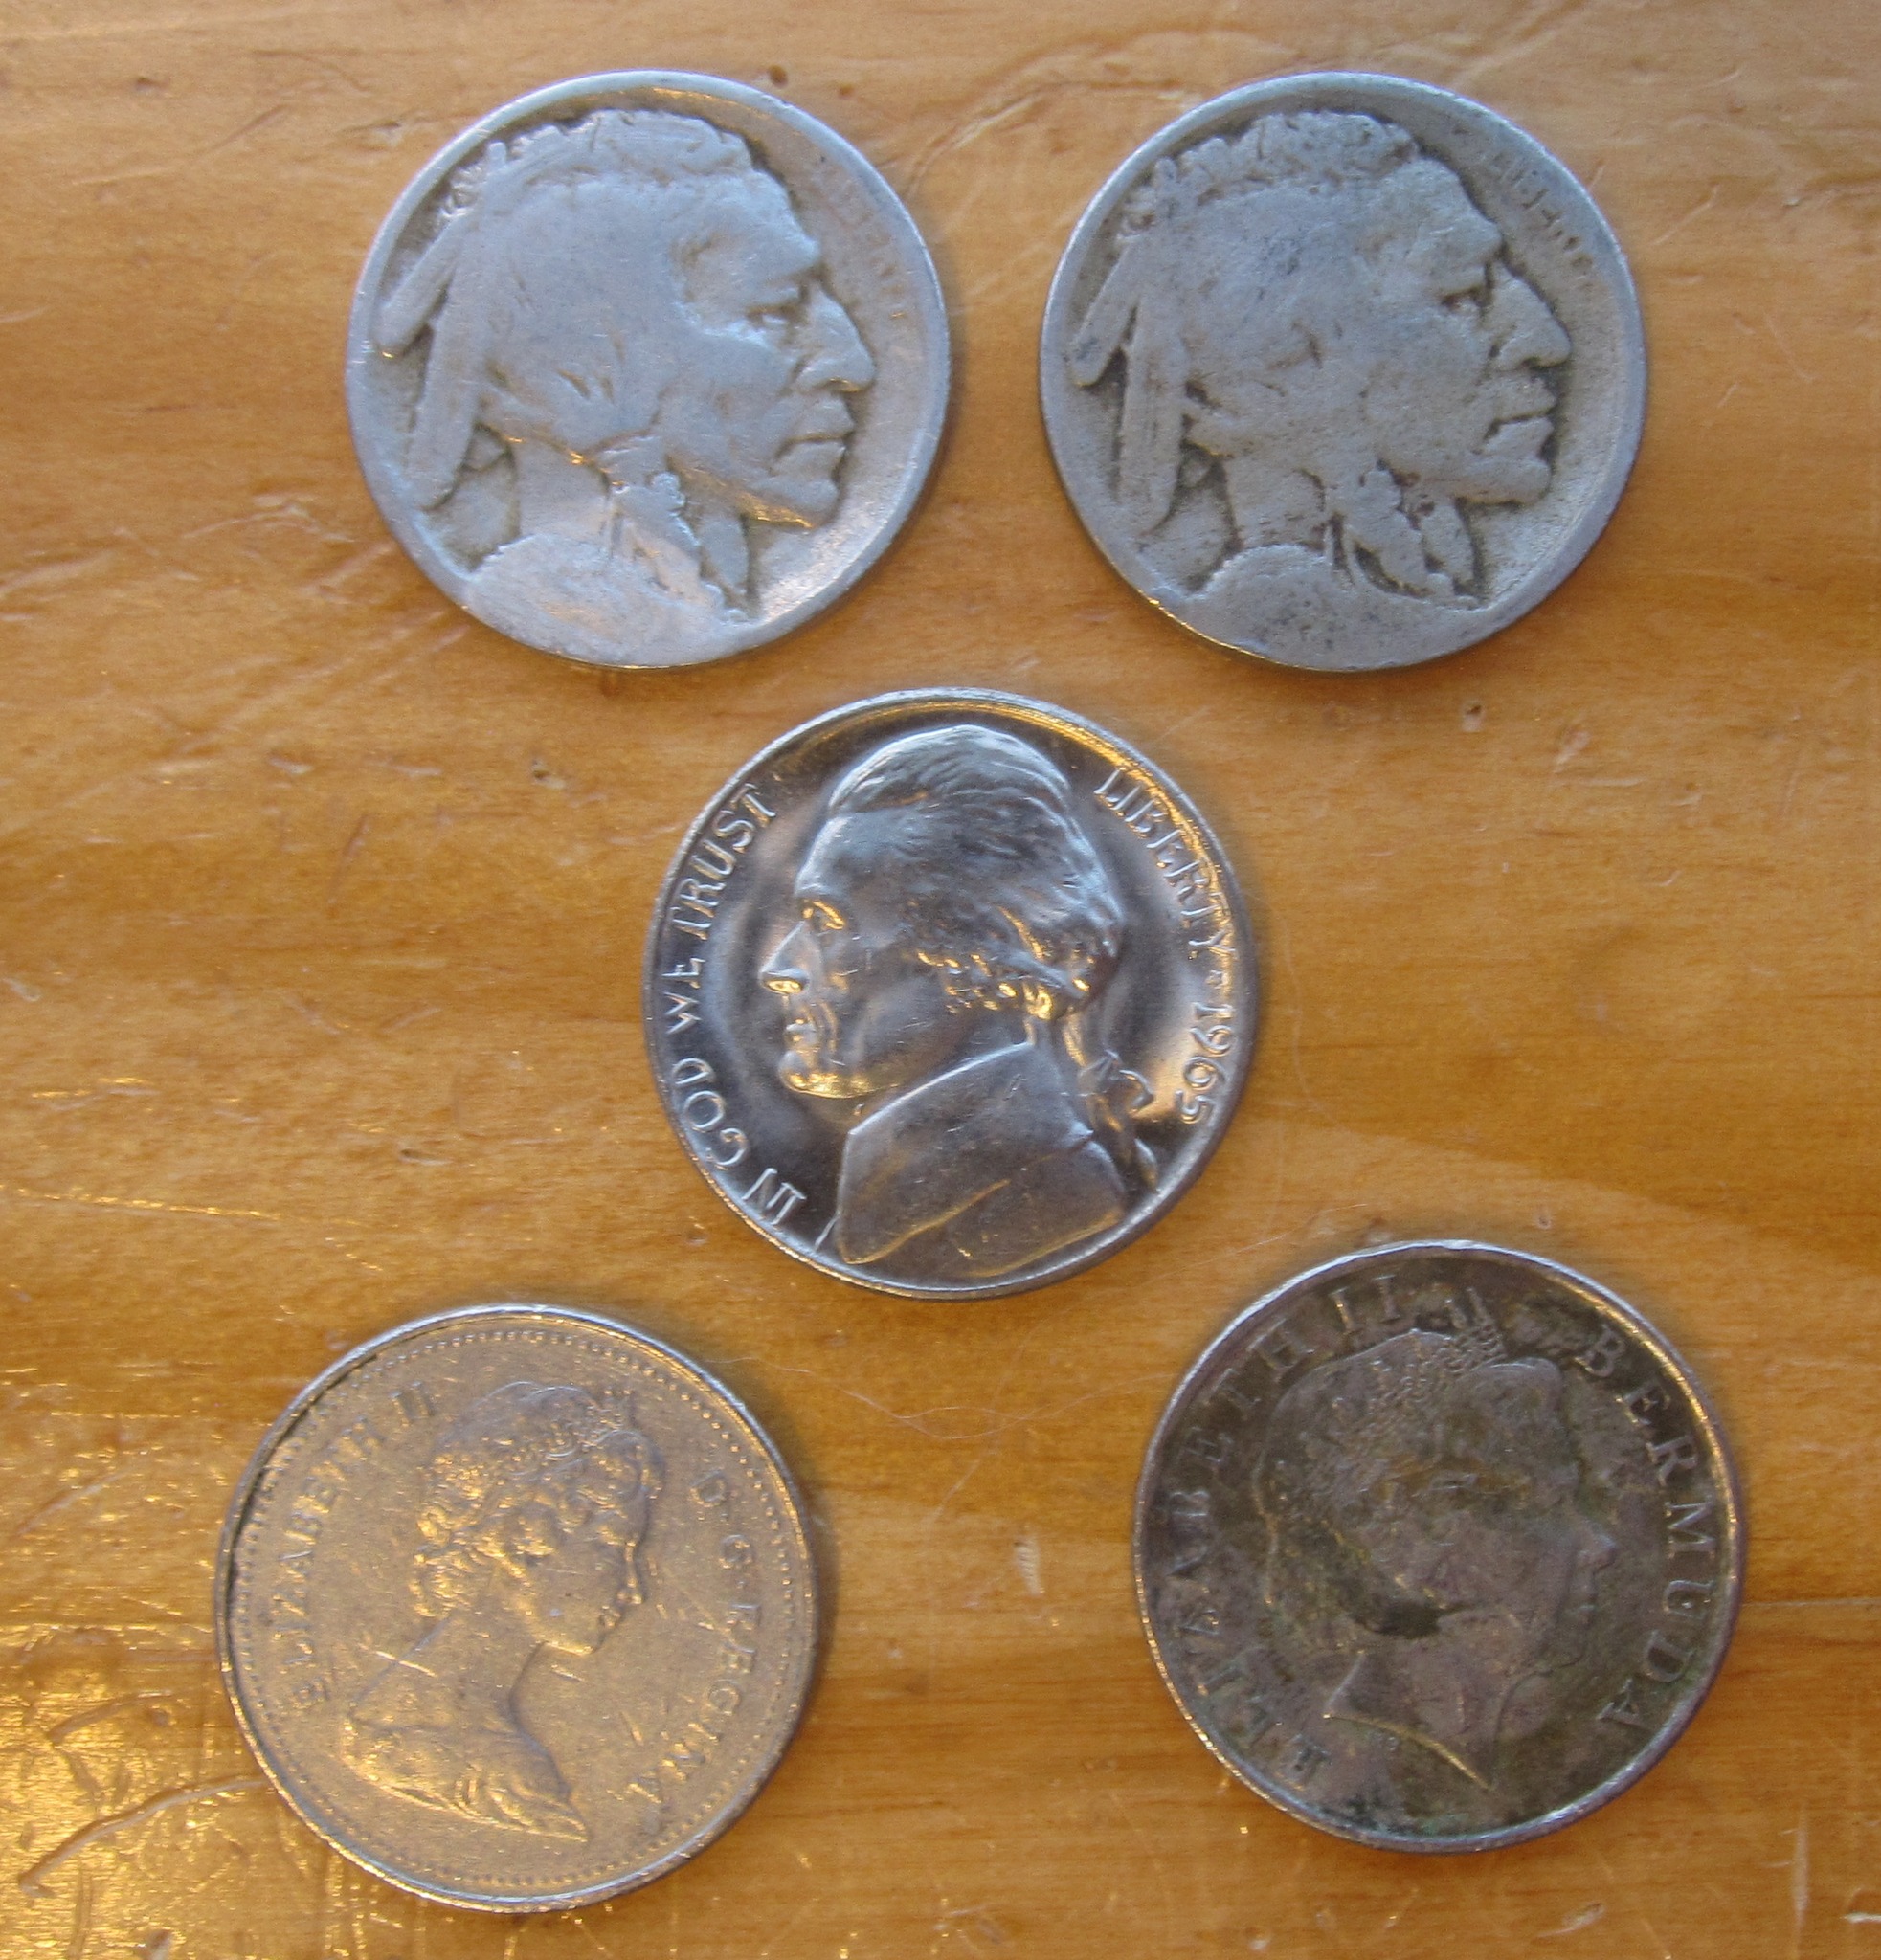
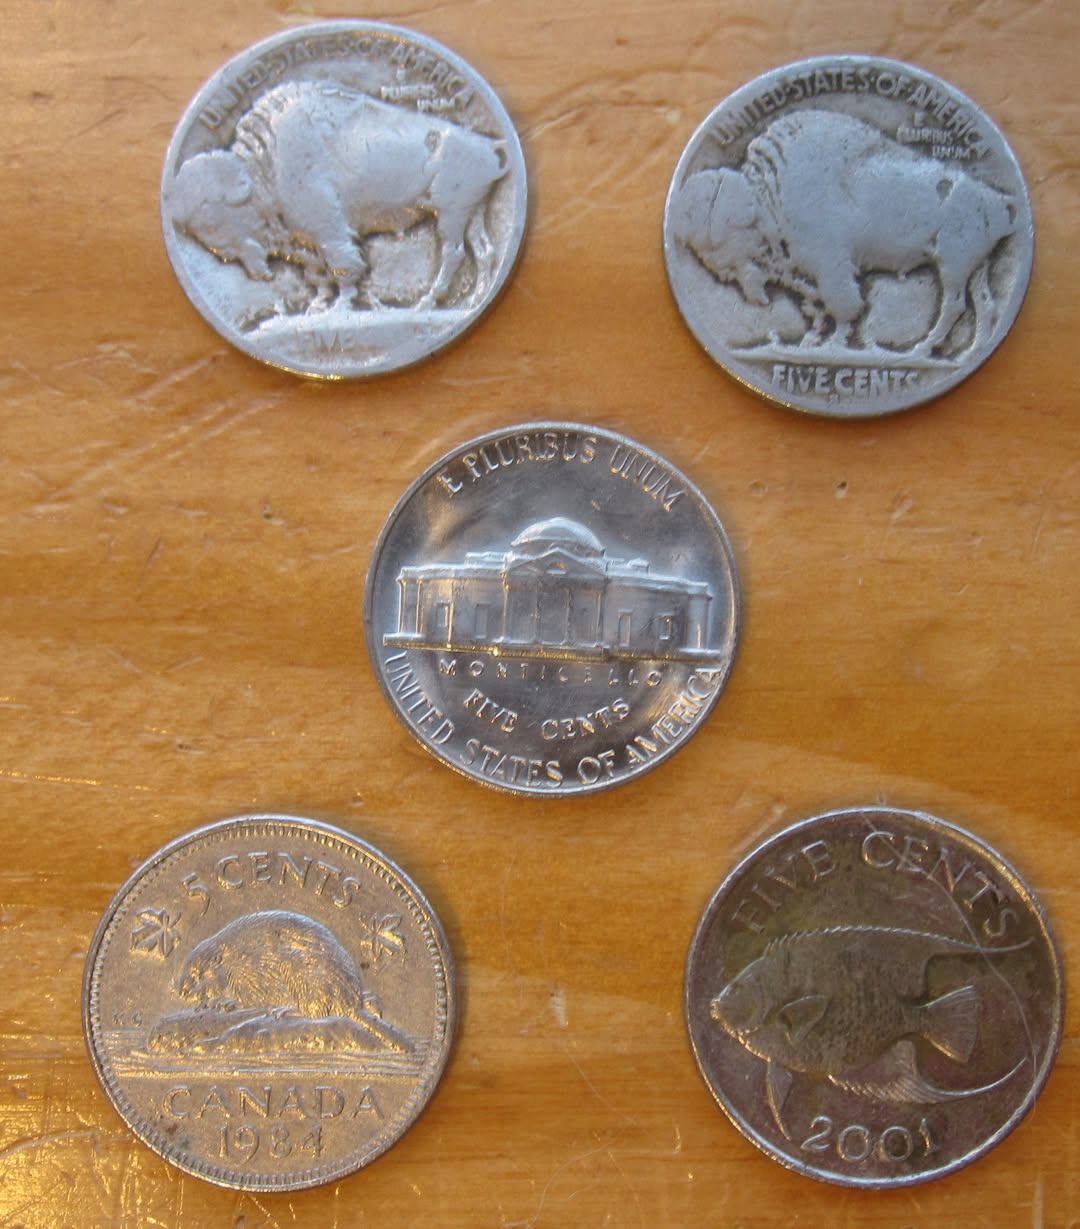
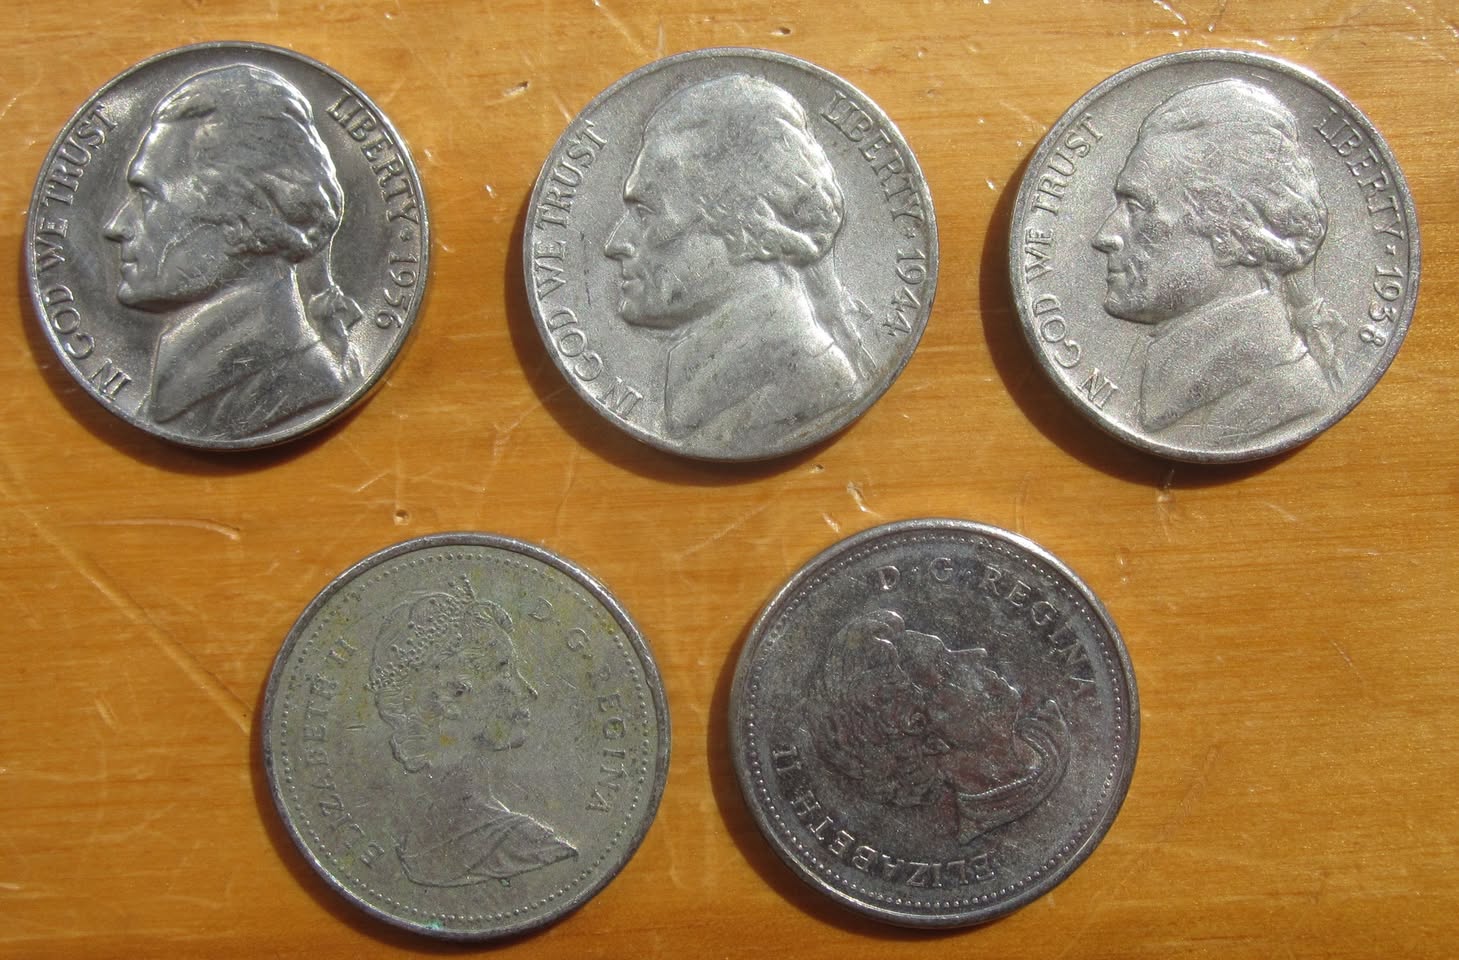
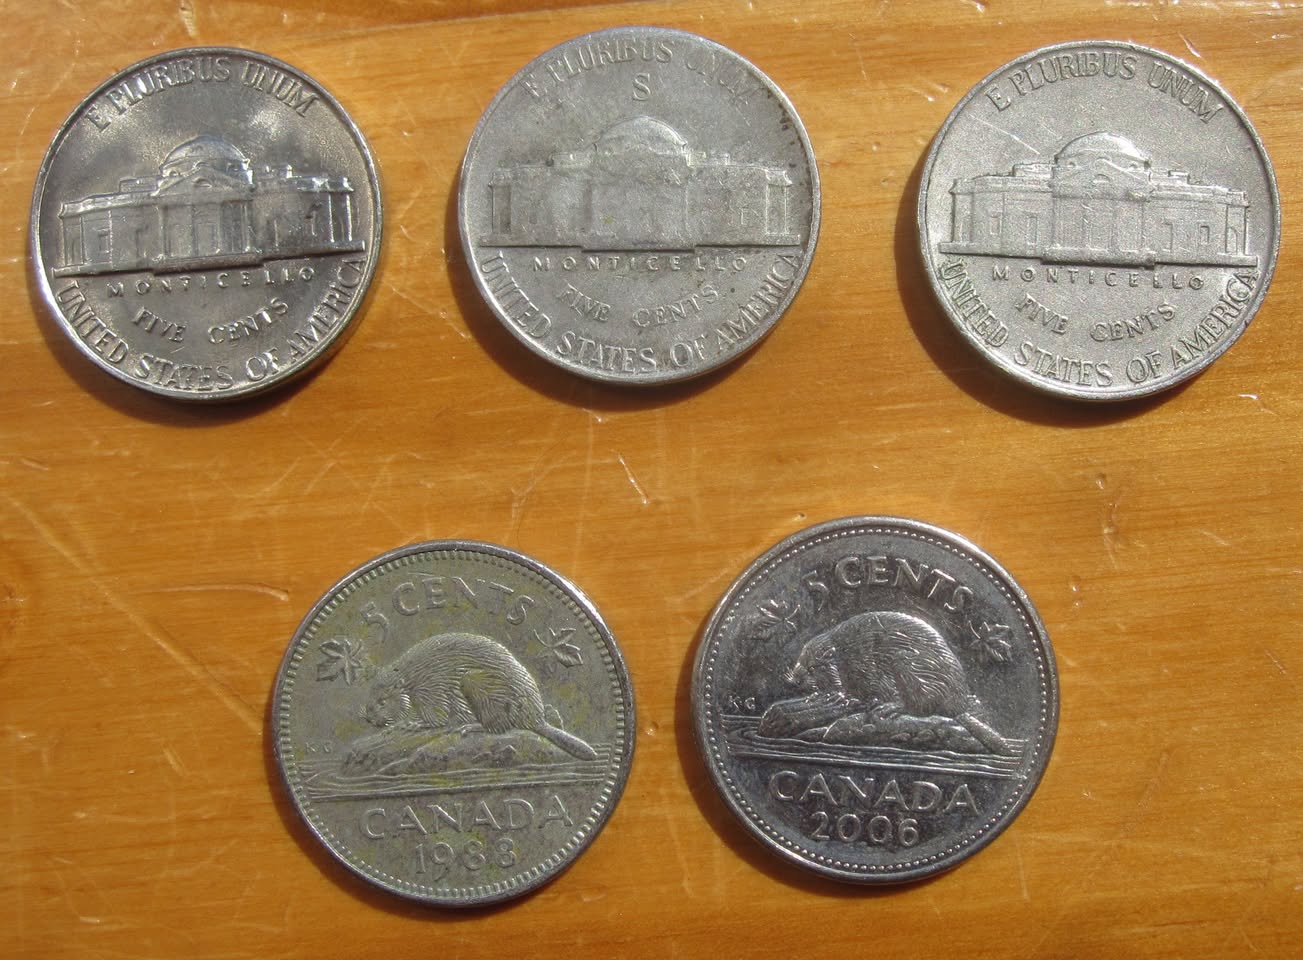
While unsurprisingly I haven’t found any Shield nickels (yet??) I have found four Liberty/V nickels. Curiously I’ve found roughly equal numbers of Buffalo, War (Silver) and Canadian nickels. They turn up on average a little better than one every other box, although you can see there’s occasionally several per box. Also a nickels from several other countries. They occur often enough from The Bahamas to warrant its own column.
Box 30 was a particularly good box with two Liberty, six Buffalo, and two silver War nickels. Possibly part of a mini collection dump?
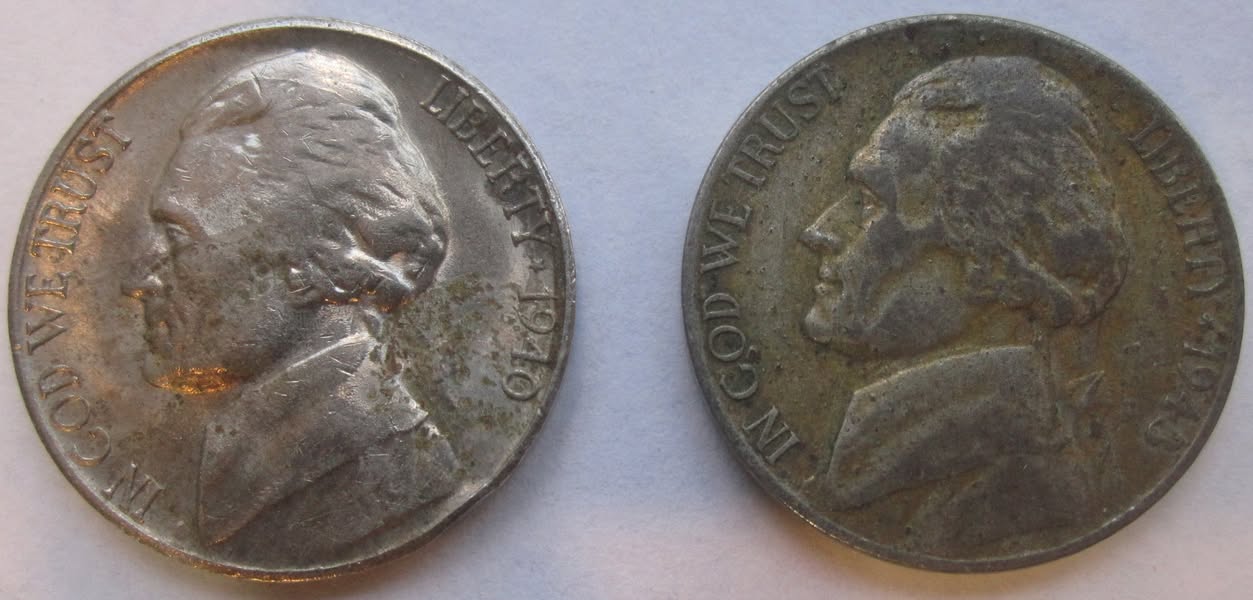
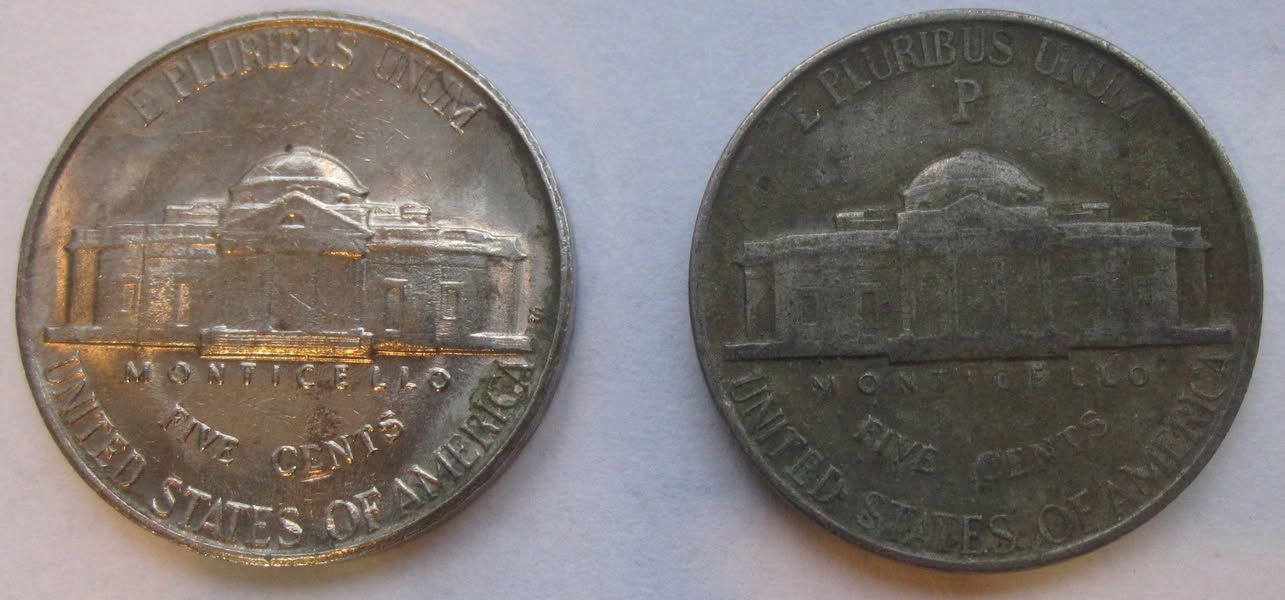
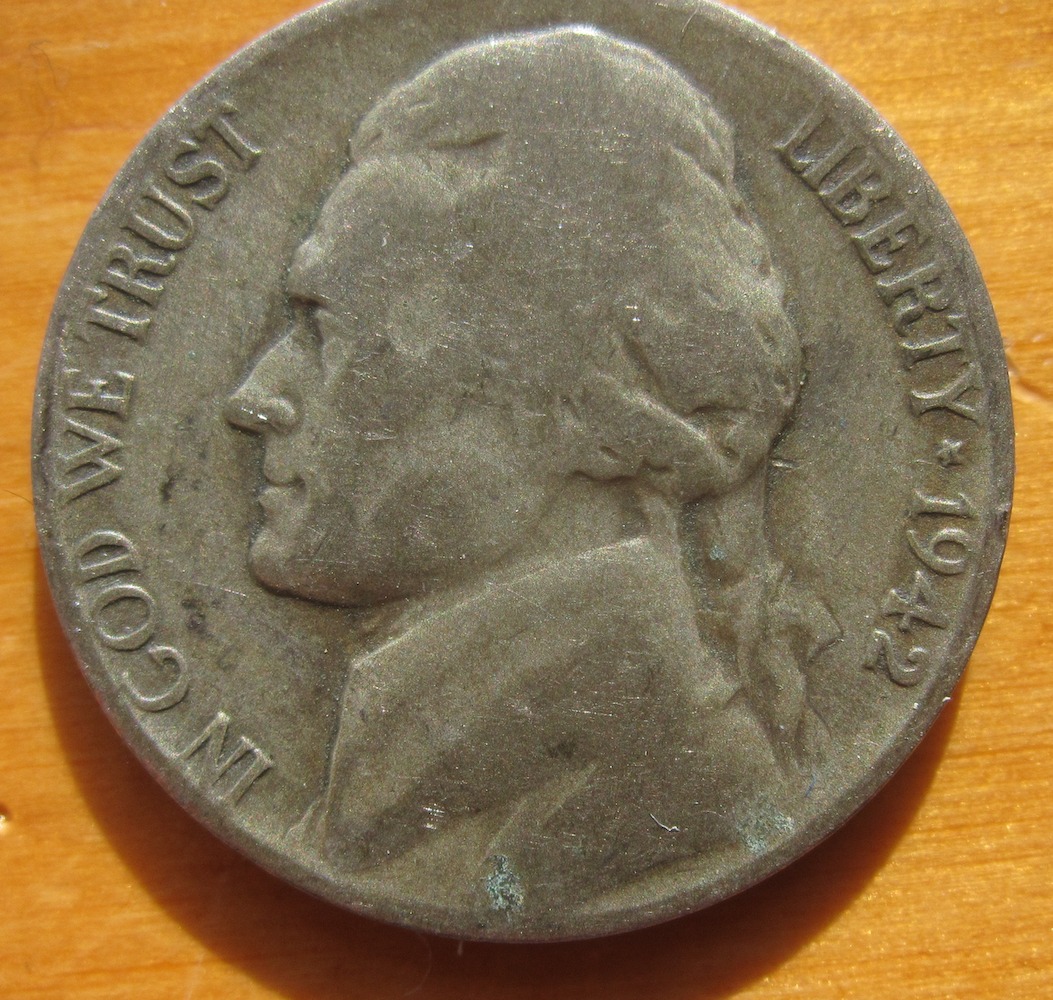
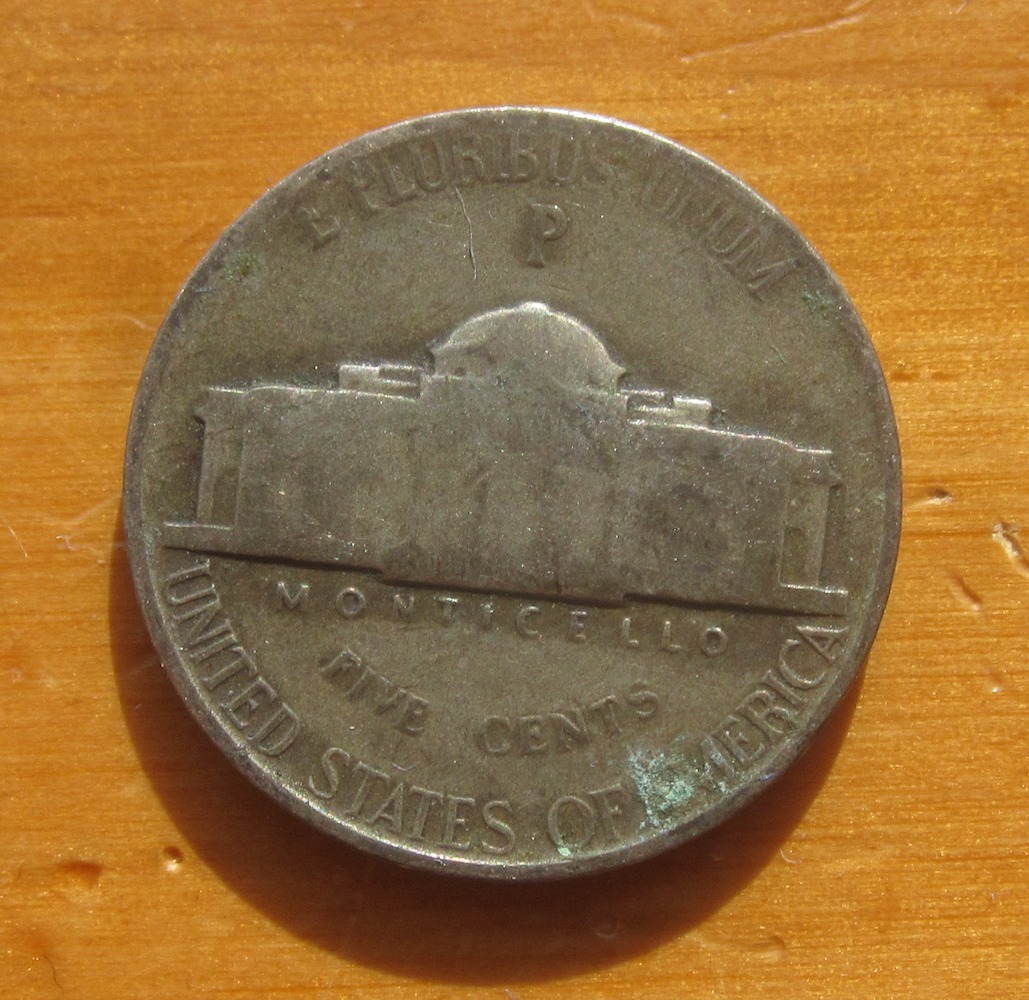
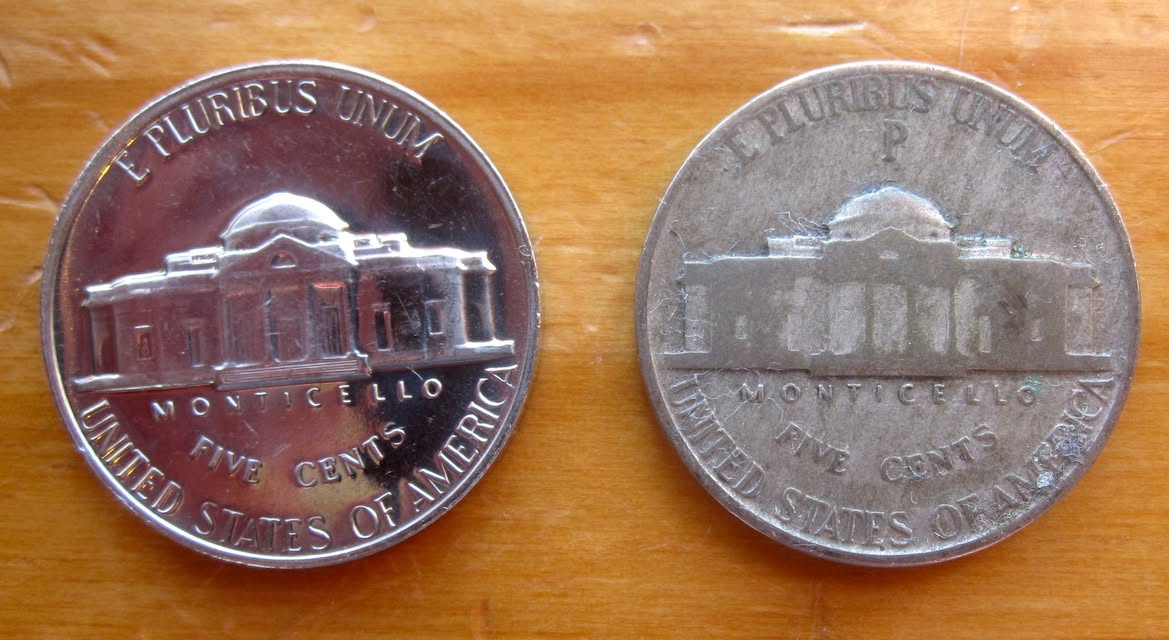
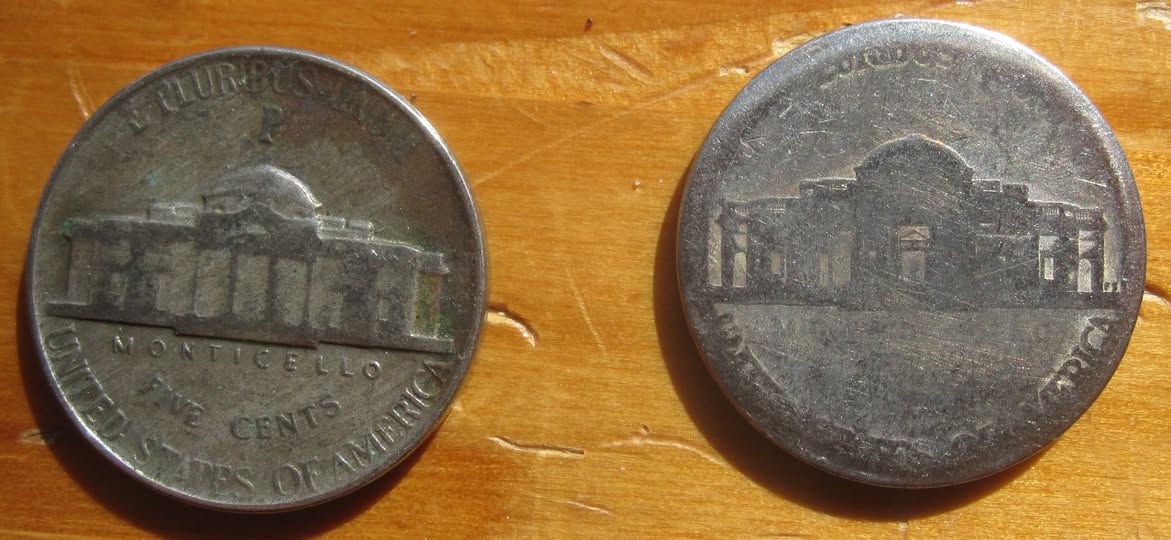
Next here’s a table showing how many of each silver War nickel I’ve found, along with the mintage for each year/mintmark and the number found per million minted. There’s too little data to see a uniform number found per mintage, although you can see it’s starting to get there. I’ve yet to find any 1943-D, the lowest mintage, and I only found the one 1944-S, the second lowest mintage, in box 60.
| Year | Mintage | Found | Found Per Million Minted |
| 1942-P Silver | 57873000 | 7 | 0.120954504 |
| 1942-S Silver | 32900000 | 1 | 0.030395137 |
| 1943-P Silver | 271165000 | 7 | 0.025814541 |
| 1943-D Silver | 15294000 | 0 | |
| 1943-S Silver | 104060000 | 5 | 0.048049202 |
| 1944-P Silver | 119150000 | 4 | 0.033571129 |
| 1944-D Silver | 32309000 | 1 | 0.030951128 |
| 1944-S Silver | 21640000 | 1 | 0.046210721 |
| 1945-P Silver | 119408100 | 7 | 0.058622489 |
| 1945-D Silver | 37158000 | 1 | 0.026912105 |
| 1945-S Silver | 58939000 | 1 | 0.016966694 |
| Total Mintage | 869896100 | 35 | 0.04023469 |
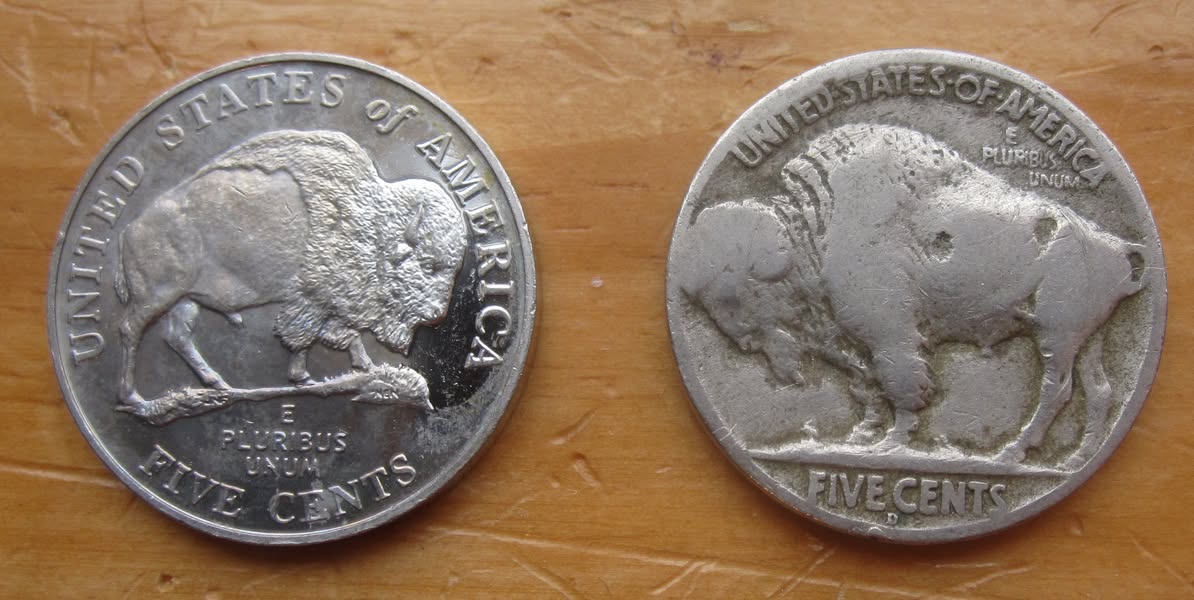
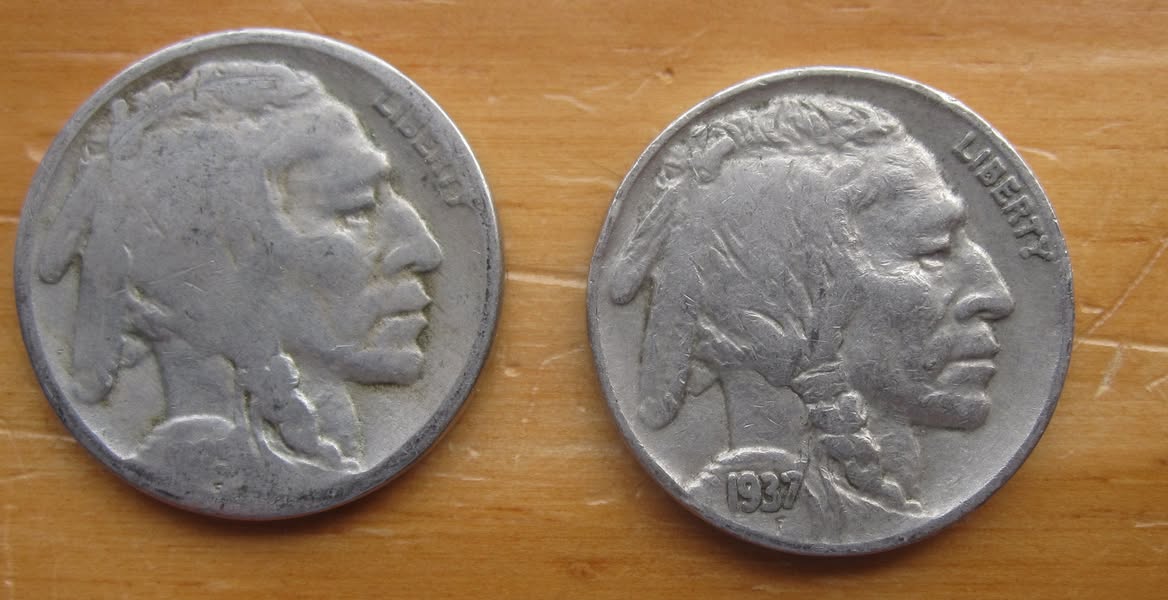
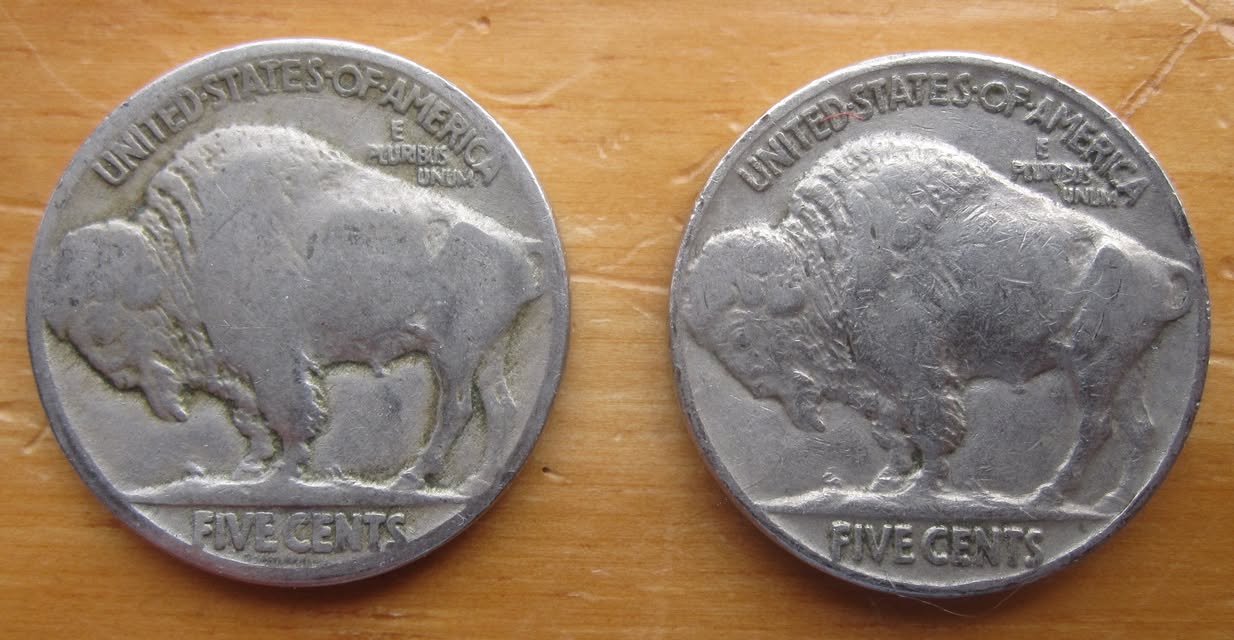
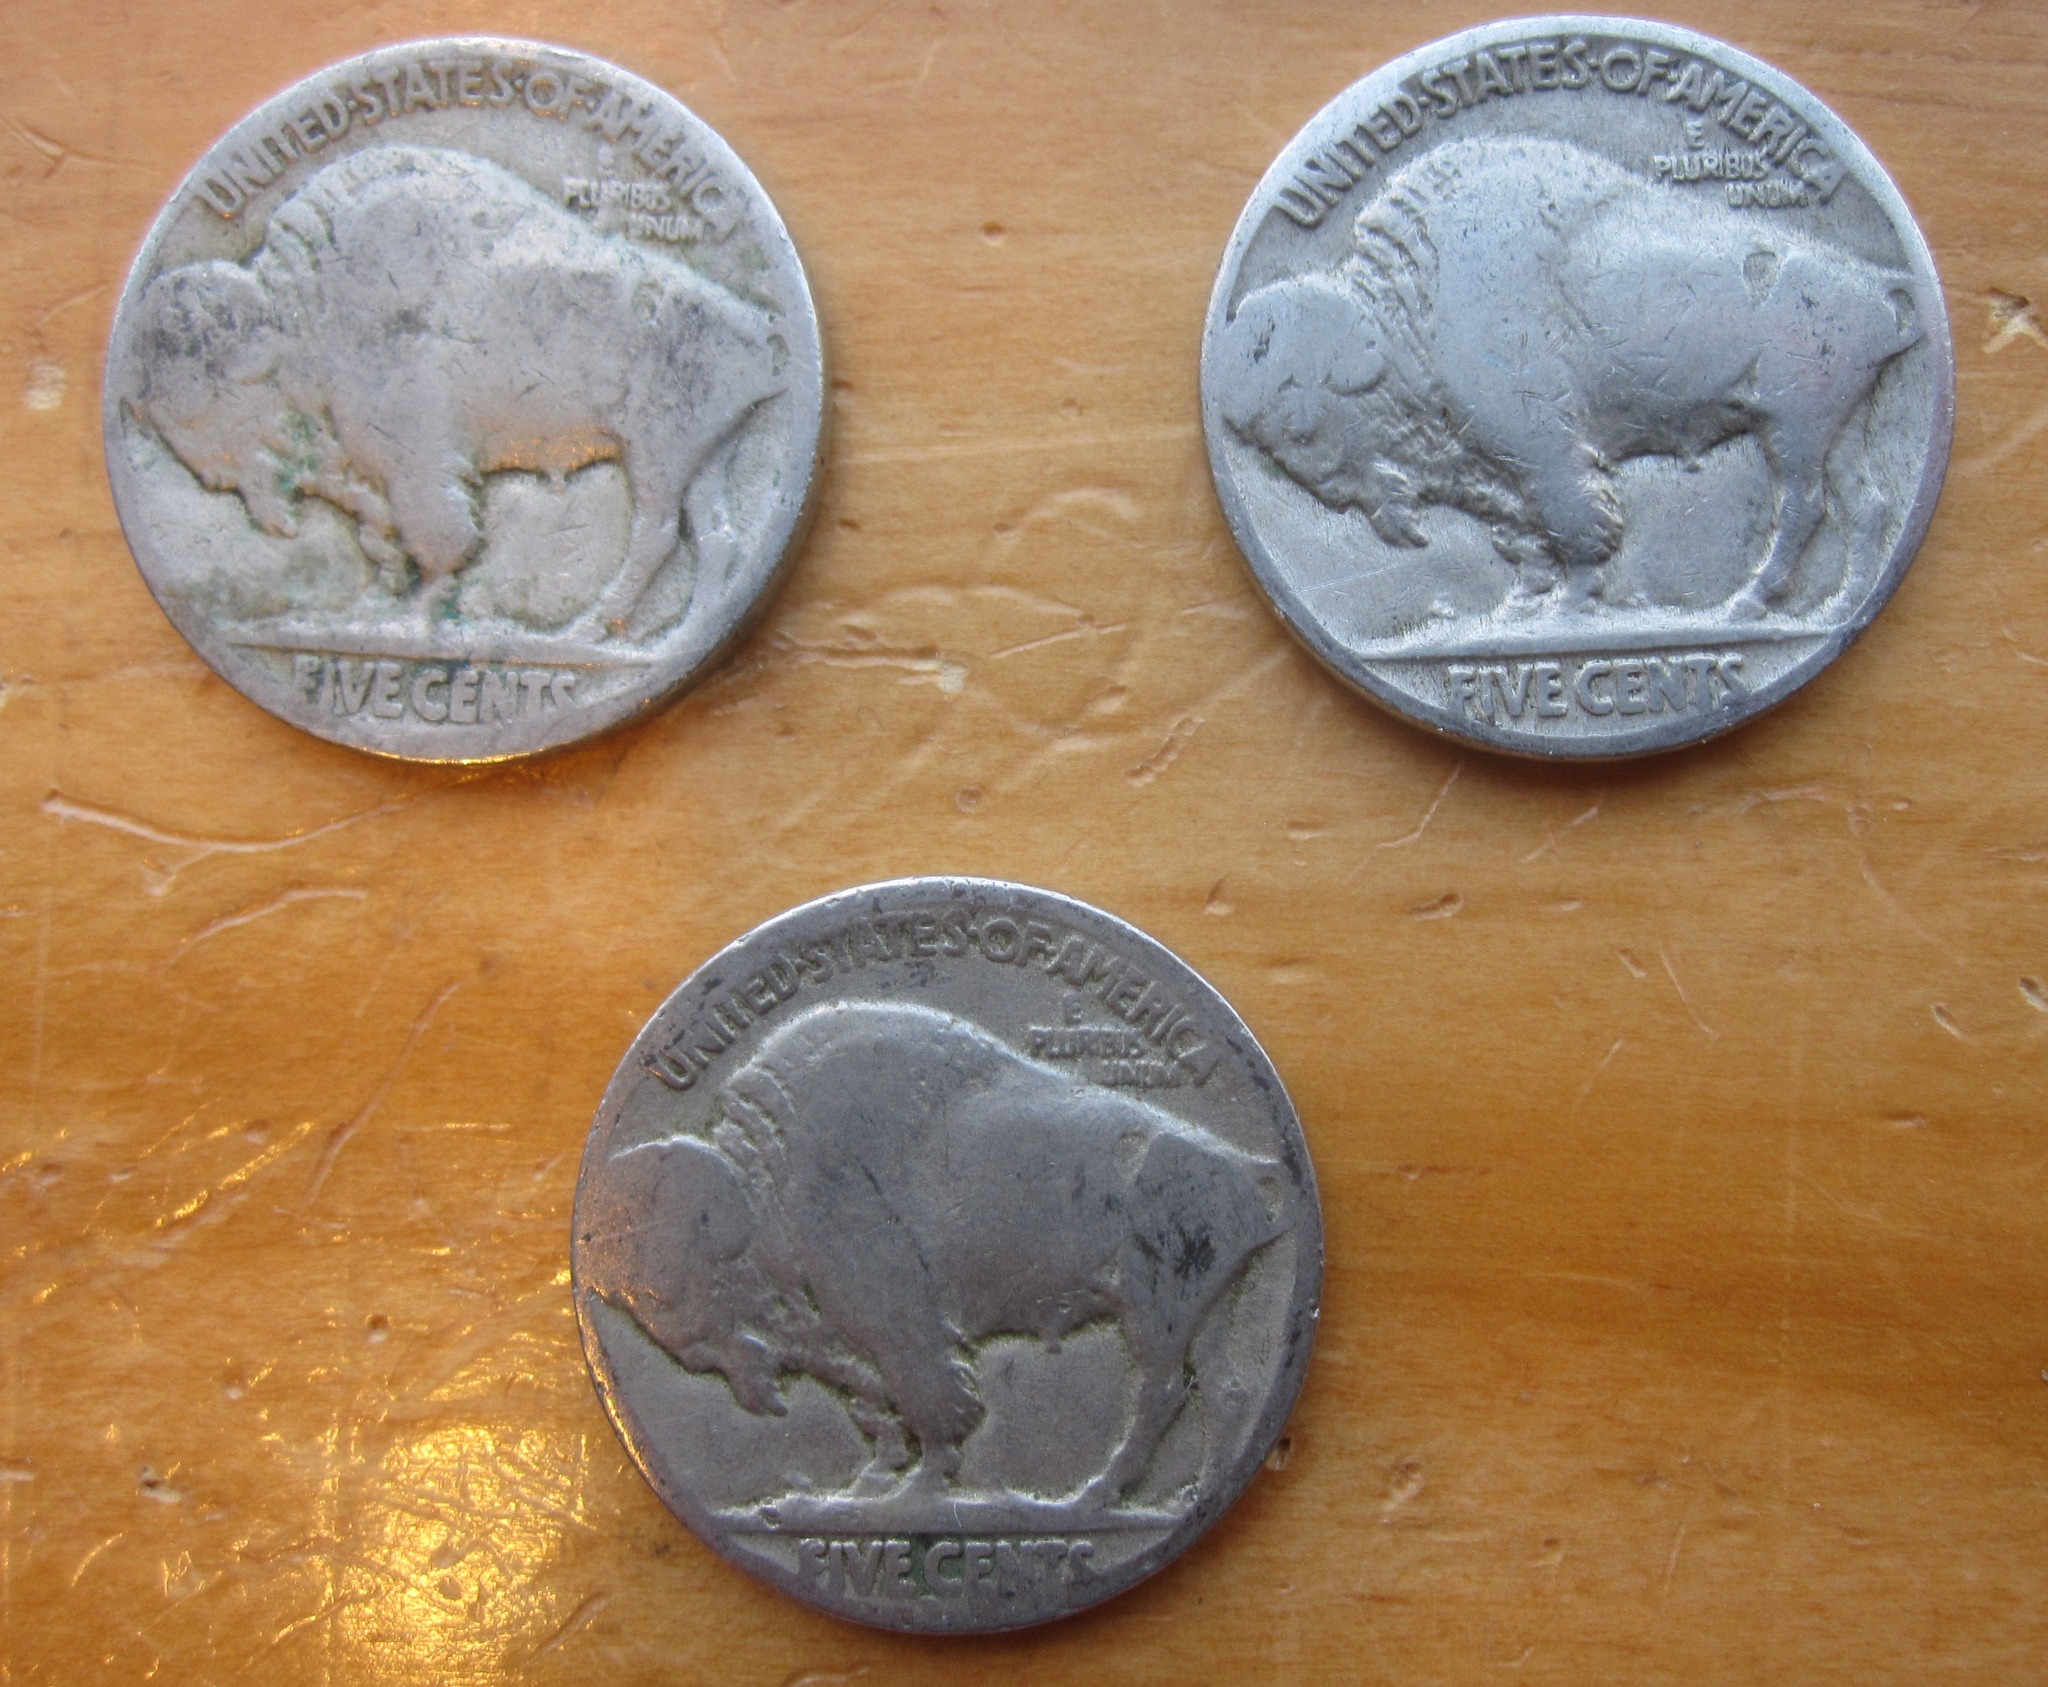
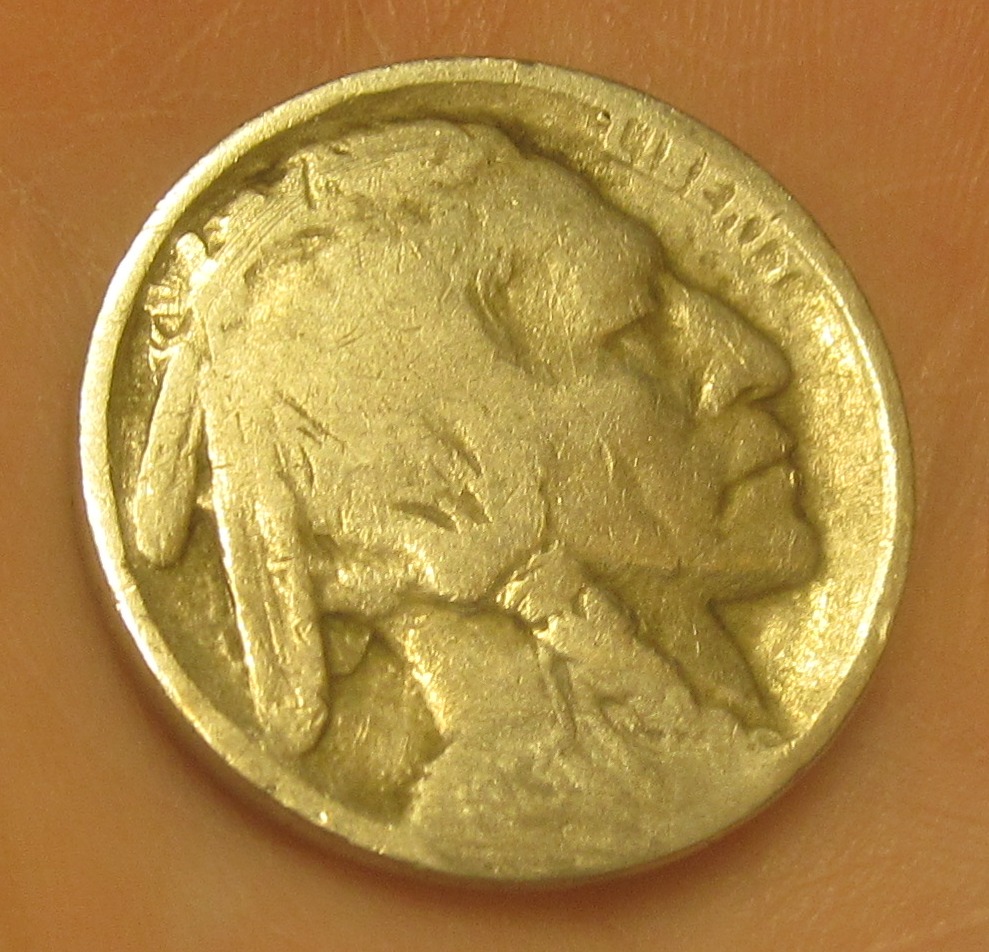
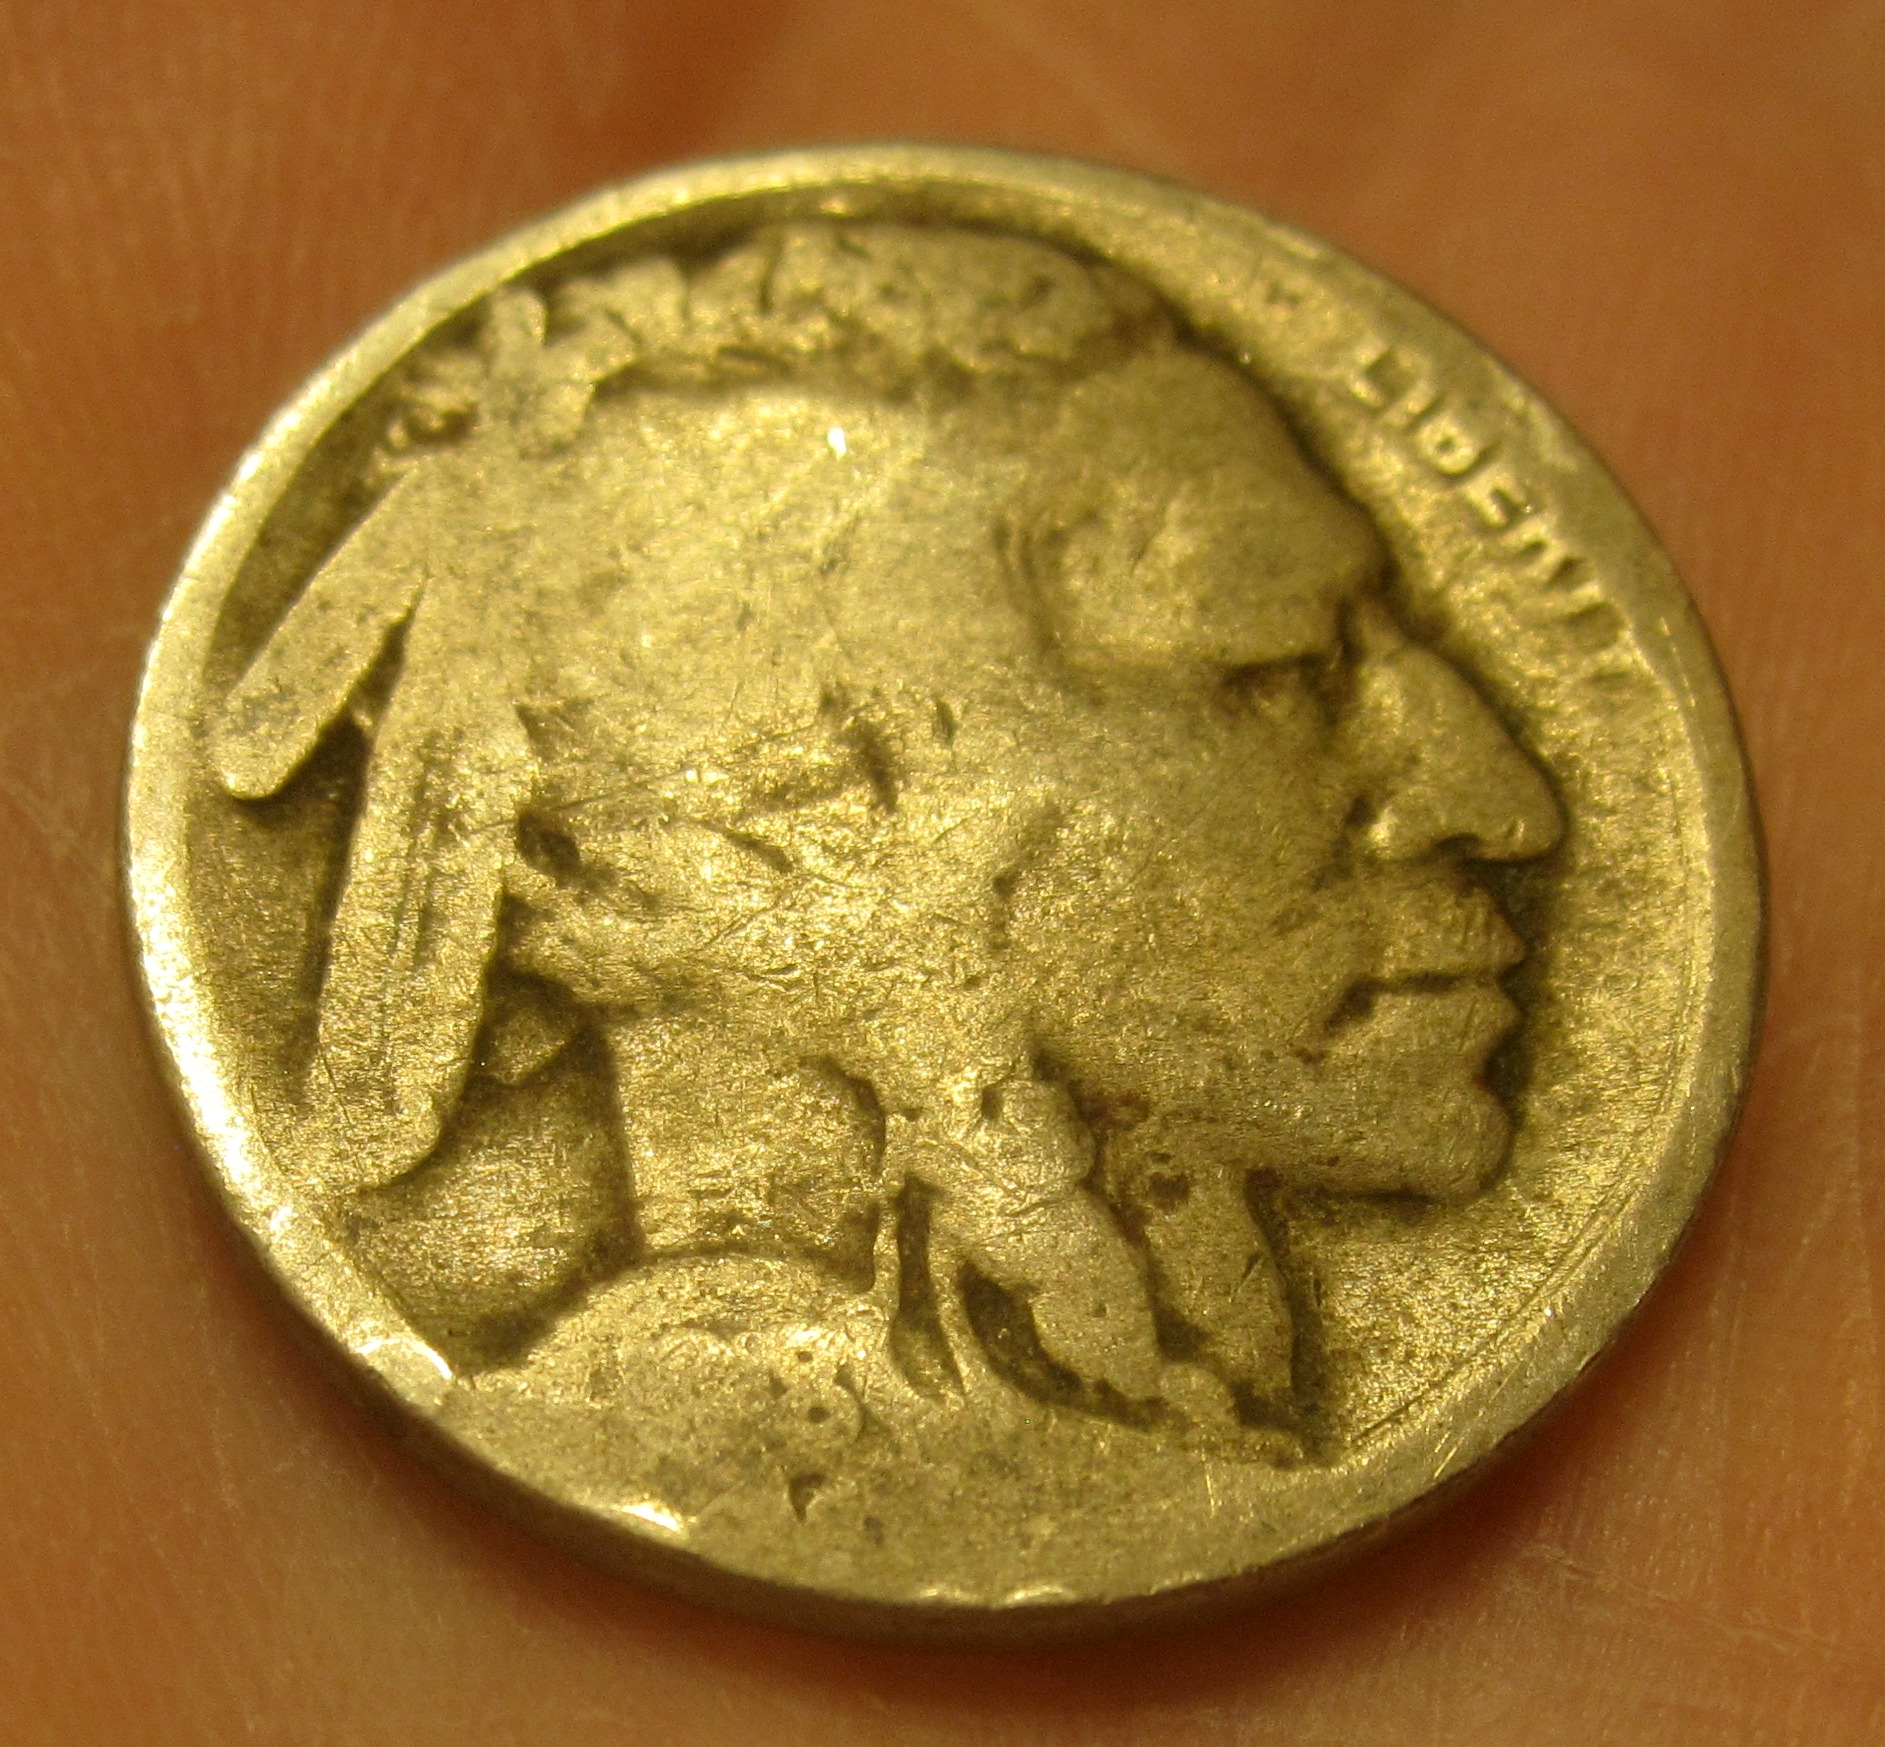
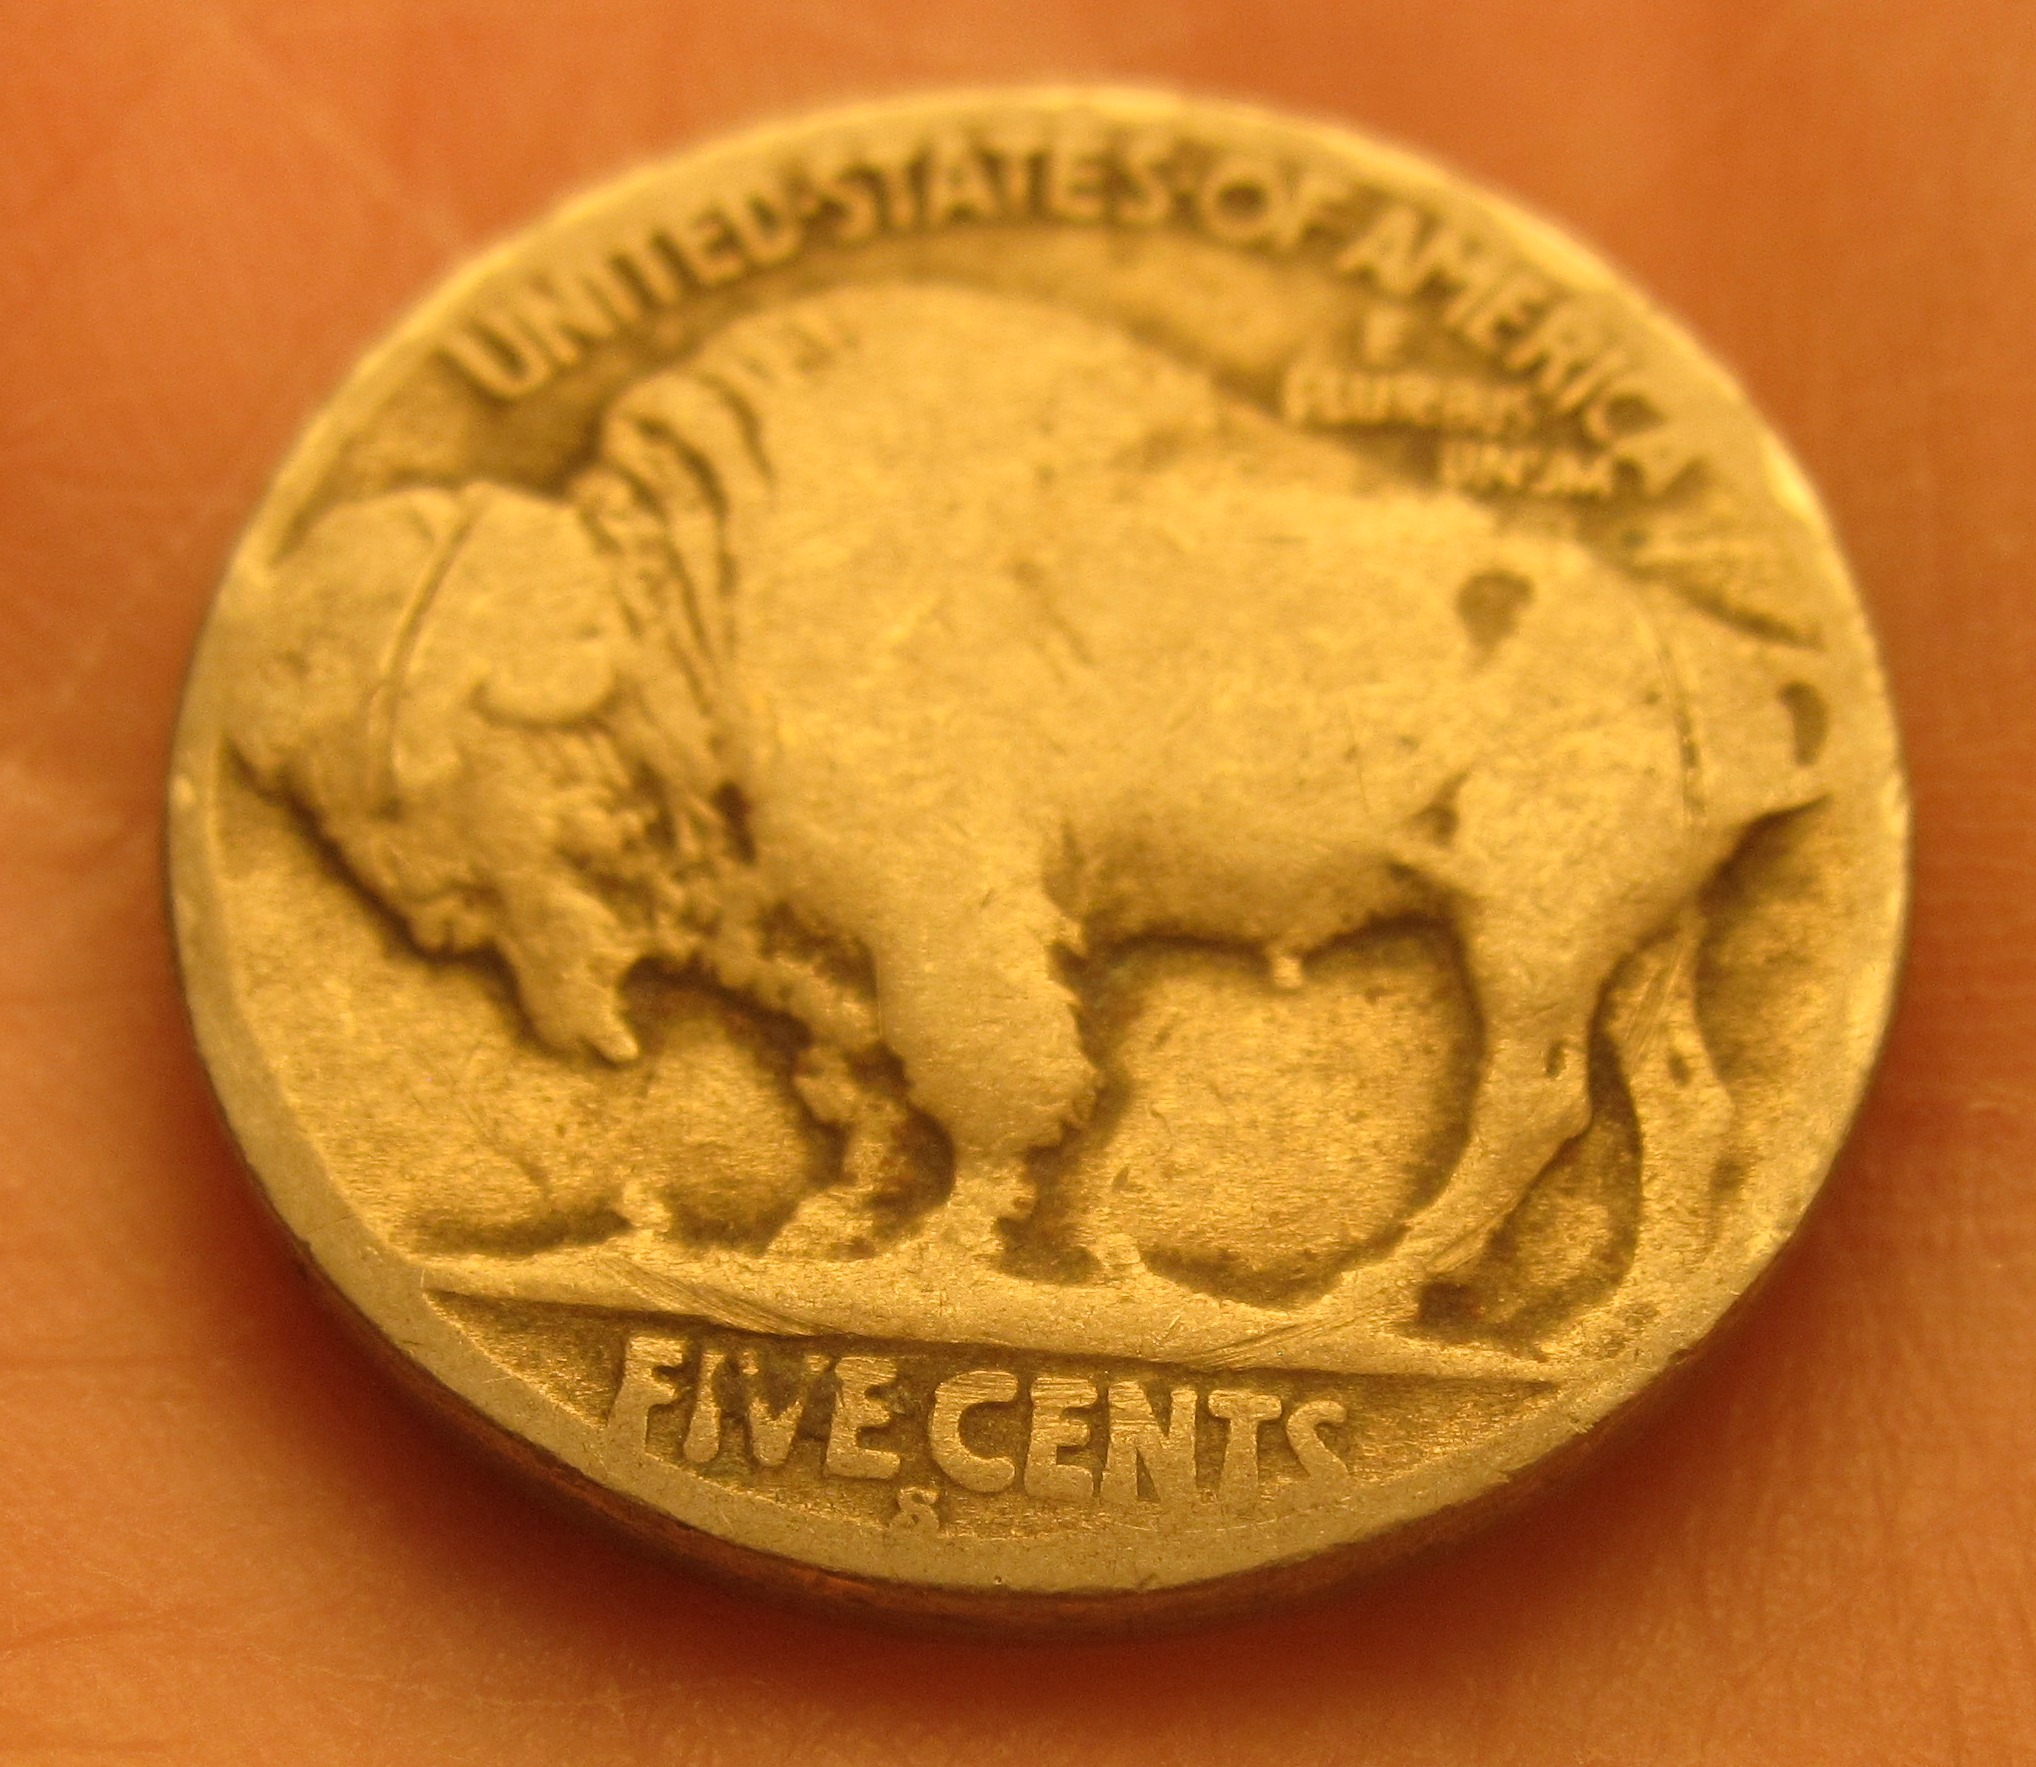
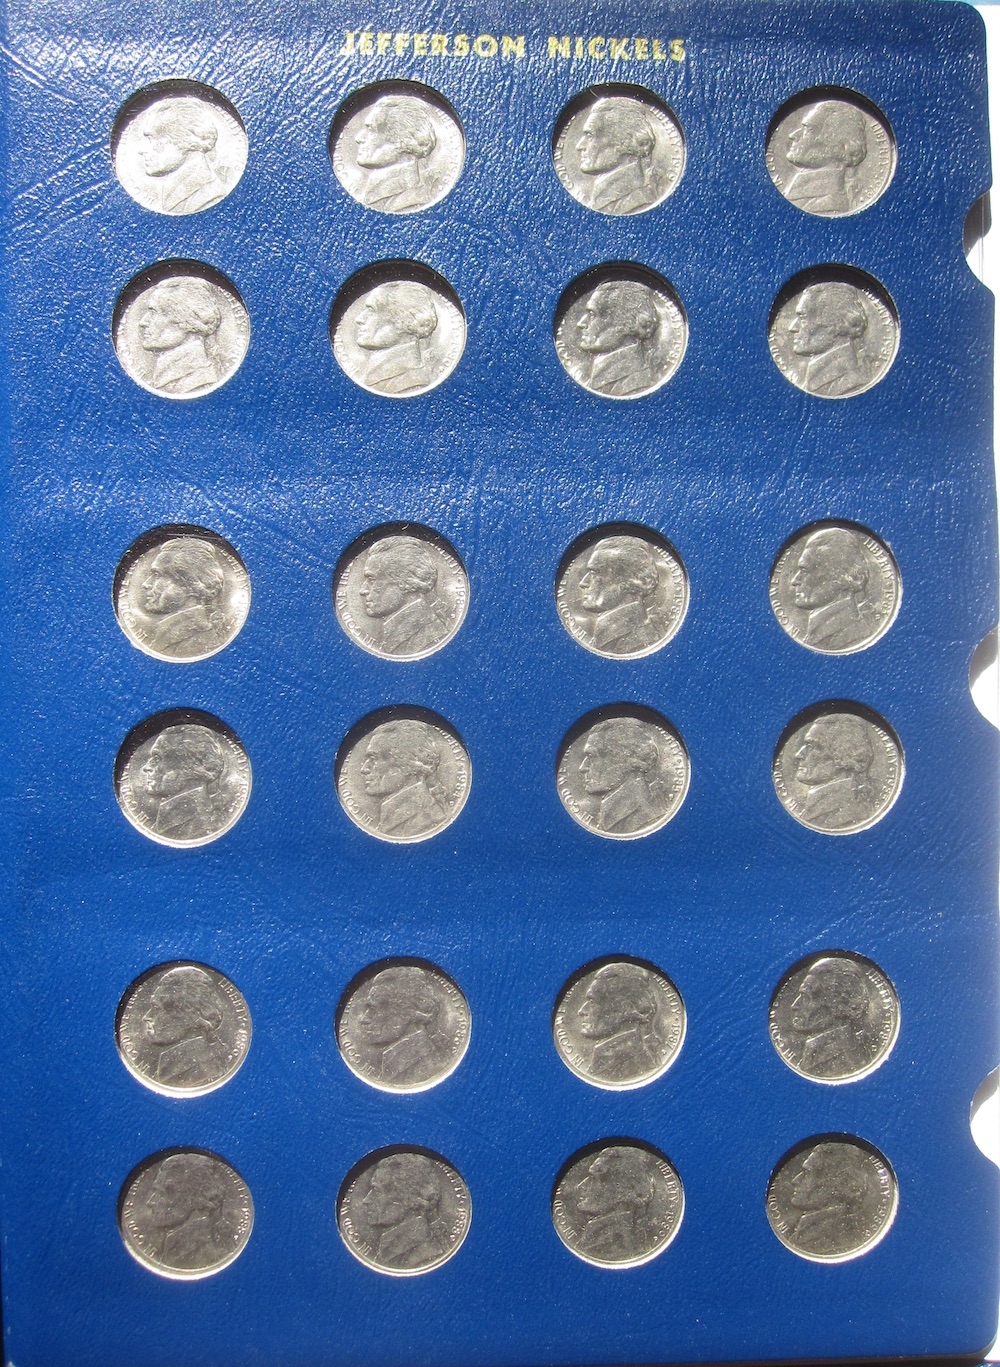
I’ve found so many Buffalo nickels along the way that I’ve also started filling an album with them, which I am also trying to fill as a parallel project. I’m not sure it’s possible to complete such an album just from circulation, but you never know… I have found several tougher (lower mintage) dates so far.
| Year | Mintage | Found | Collection |
| 1913 Variety 1 | 30,993,520 | 1 | 1 |
| 1913-D Variety 1 | 5,337,000 | ||
| 1913-S Variety 1 | 2,105,000 | 1 | 1 |
| 1913 Variety 2 | 29,858,700 | ||
| 1913-D Variety 2 | 4,156,000 | ||
| 1913-S Variety 2 | 1,290,000 | ||
| 1914 | 20,665,738 | ||
| 1914-D | 3,912,000 | ||
| 1914-S | 3,470,000 | ||
| 1915 | 20,987,270 | ||
| 1915-D | 7,569,000 | ||
| 1915-S | 1,505,000 | ||
| 1916 | 63,498,066 | 1 | 1 |
| 1916-D | 13,333,000 | ||
| 1916-S | 11,860,000 | ||
| 1917 | 51,424,019 | 1 | 1 |
| 1917-D | 9,910,000 | ||
| 1917-S | 4,193,000 | ||
| 1918 | 32,086,314 | 3 | 1 |
| 1918-D | 8,362,000 | ||
| 1918-S | 4,882,000 | 1 | 1 |
| 1919 | 60,868,000 | 1 | 1 |
| 1919-D | 8,006,000 | ||
| 1919-S | 7,521,000 | ||
| 1920 | 63,093,000 | 2 | 1 |
| 1920-D | 9,418,000 | 2 | 1 |
| 1920-S | 9,689,000 | 1 | 1 |
| 1921 | 10,663,000 | ||
| 1921-S | 1,557,000 | ||
| 1923 | 35,715,000 | ||
| 1923-S | 6,142,000 | ||
| 1924 | 21,620,000 | ||
| 1924-D | 5,258,000 | ||
| 1924-S | 1,437,000 | ||
| 1925 | 35,565,100 | 1 | 1 |
| 1925-D | 4,450,000 | ||
| 1925-S | 6,256,000 | ||
| 1926 | 44,693,000 | 1 | 1 |
| 1926-D | 5,638,000 | ||
| 1926-S | 970,000 | ||
| 1927 | 37,981,000 | 1 | 1 |
| 1927-D | 5,730,000 | 1 | 1 |
| 1927-S | 3,430,000 | ||
| 1928 | 23,411,000 | 1 | 1 |
| 1928-D | 6,436,000 | 1 | 1 |
| 1928-S | 6,936,000 | ||
| 1929 | 36,446,000 | 2 | 1 |
| 1929-D | 8,370,000 | ||
| 1929-S | 7,754,000 | ||
| 1930 | 22,849,000 | ||
| 1930-S | 5,435,000 | ||
| 1931-S | 1,200,000 | ||
| 1934 | 20,213,003 | 1 | 1 |
| 1934-D | 7,480,000 | ||
| 1935 | 58,264,000 | 2 | 1 |
| 1935-D | 12,092,000 | ||
| 1935-S | 10,300,000 | ||
| 1936 | 119,001,420 | 5 | 1 |
| 1936-D | 24,814,000 | ||
| 1936-S | 14,930,000 | ||
| 1937 | 79,485,769 | 3 | 1 |
| 1937-D | 17,826,000 | ||
| 1937-S | 5,635,000 | 1 | 1 |
| 1938-D | 7,020,000 | ||
| Total: | 1,212,995,919 | 34 | 22 |
| Percent of album filled: | 34.4 |
The collection column contains a 1 for each year/mintmark I have found. So far I’ve filled over a third of the album. Not bad! I don’t think I’ll try assembling a Liberty/V nickel album. Probably not.
Part way through this project, the last 16 boxes actually, I started to record each and every nickel found, to get more detailed statistical data, 31997 nickels in total (missing 3 nickels due either to damaged dates or short rolls).
I then plotted this data for each year, relative to the number of nickels minted for that year, and also multiplied by a scaling factor relative to the total number of nickels searched. Here’s my idea… Let’s (incorrectly but simply) assume that every nickel minted stays in circulation. We know that’s not the case, but let’s start there. Let’s also assume the nickels minted are uniformly mixed.
Think of it this way: Assume all the nickels ever minted were dumped into a giant container, say a huge swimming pool, and mixed. And each box of nickels is 2,000 nickels randomly selected from it. We’d expect the number of each nickel (year/mint) found to be proportional to the number minted.
In reality, coins are continuously removed from circulation by several mechanisms. First, coins are lost. They fall on the ground, into sofa cushions, wherever. They get removed, permanently, from circulation. Another way they get removed from circulation is purposely, mostly by collections. Older (Buffalo/Liberty) nickels, silver War nickels, key dates, etc. They also get temporarily removed from circulation as people throw their change into jars, to then later take to the bank and dump. Perhaps much later. This mechanism I suspect often accounts for many of the cool finds we see. I suppose “collection dumps” could be included in this category.
Another factor is location. I am in Maryland. In general new coins from Philadelphia are released here. I say in general because I have, rarely, gotten entire boxes of shiny new coins from Denver. But the vast majority of the time I expect they are from Philadelphia. It takes time for coins from Denver to work their way here, and even longer for those from San Francisco. So I expect much fewer of them to be found here.
By comparing what we actually find in circulation to what we “should” find, i believe we can, at least crudely, estimate what has been removed from circulation, both due to loss and willful removal by collectors, and even, also crudely, separate those two numbers.
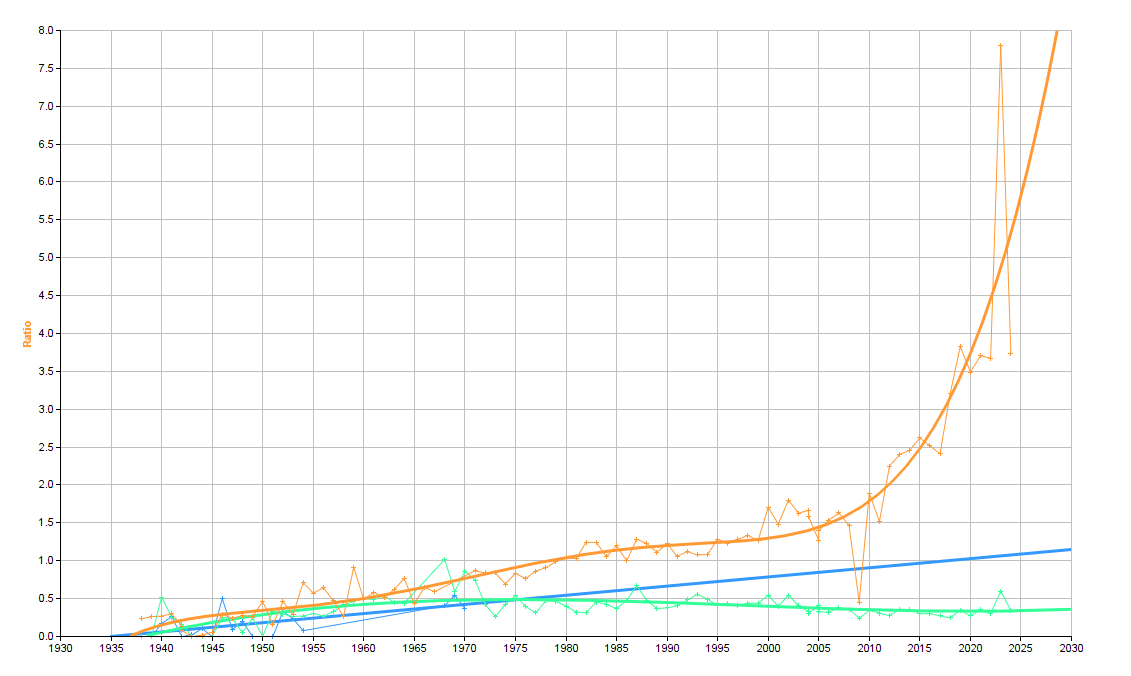
This first graph shows these plots for Jefferson nickels from all three mints. Philadelphia is orange, Denver green, San Francisco blue. The thin trace for each is the actual data, the thicker line is a least squares regression fit.
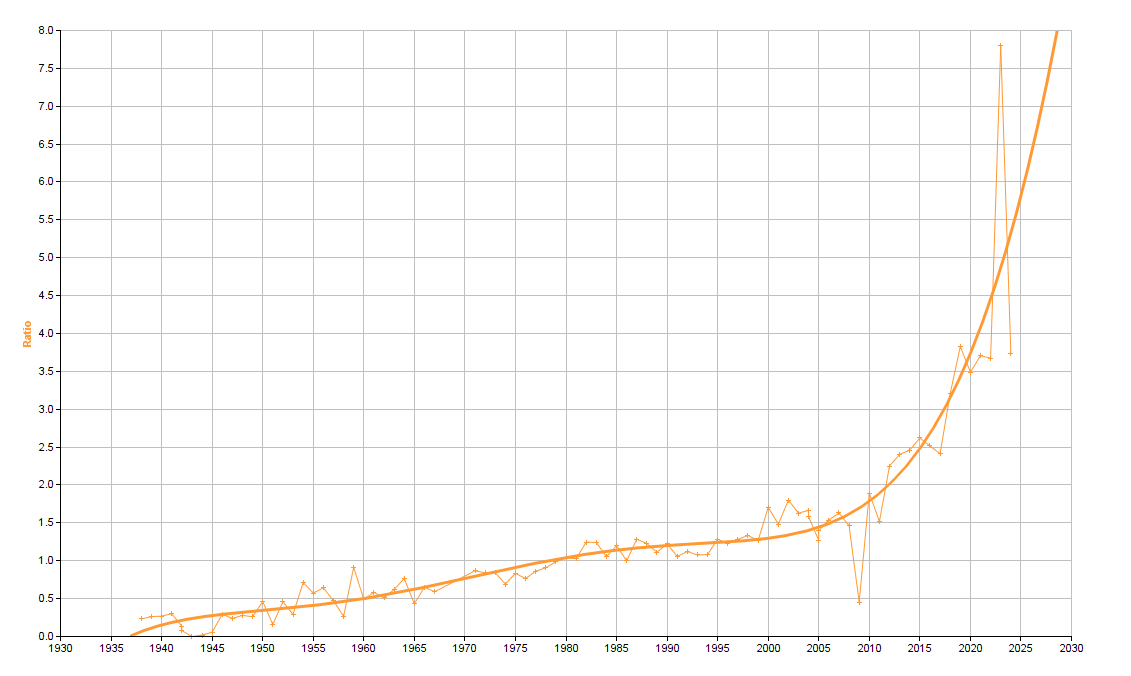
To make viewing the graphed data easier, I’ve created three separate graphs, each showing just one mint. Below is Philadelphia. A few things are striking to me. First, you can see the substantial over-representation of nickels from recent years. 2023 in particular of course, but others as well. This quickly falls with a knee in the curve roughly around 2010, then begins to taper off as you go back further in time. Nickels from the 1990s are still plentiful, the 80s less so, and the 70s much less so. Noticeably few 60s nickels are found (except for 1964 of course!), and then by the 40s and 50s they’re really uncommon. 30s are really tough, I average one per box. The fairly low mintages in the late 40s and early to mid 50s is likely a factor as well, as well as removal of most of the silver War nickels.
You can also see the dip in 2009 which was a very low mintage year. This graph is adjusted for mintage however. So 2009 nickels are being found even lower in proportion to what you would expect, by about two thirds! This suggests to me that many have been removed from circulation by collectors. I have seen claims that most of the 2009 nickels were sent to Puerto Rico, but have never found concrete evidence this actually happened, so I am not sure if it is indeed the case. 2024 was another low mintage year, and again they are found well below their expected (low) numbers. And again, I know many collectors keep every 2024 nickel they find (I am guilty of this myself).
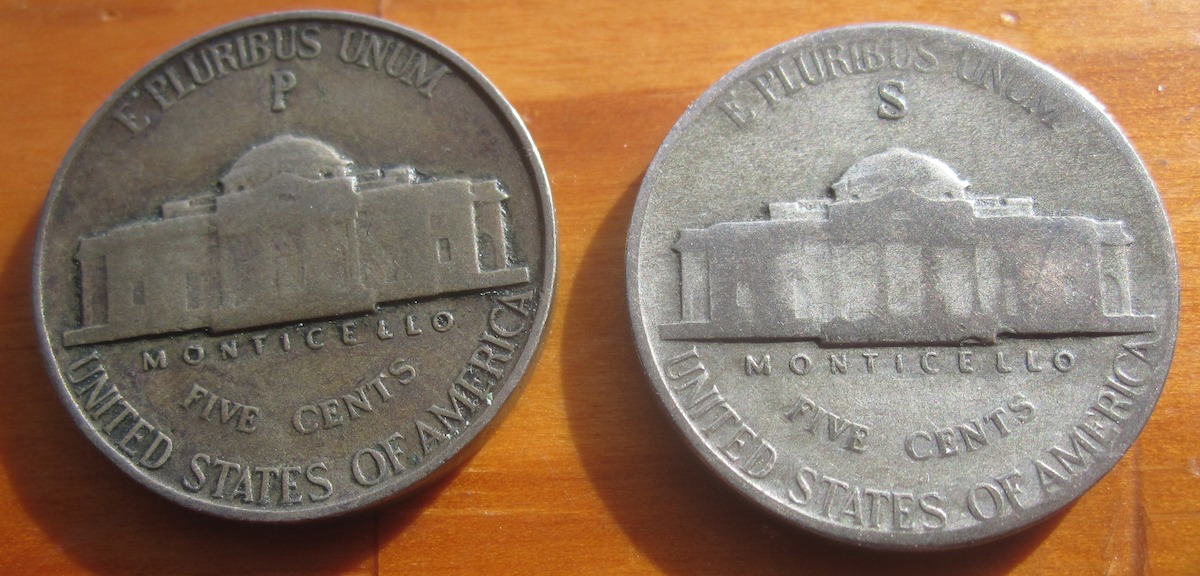
You can also see the dip to nearly zero during the period silver War nickels were minted, as most have been removed from circulation.
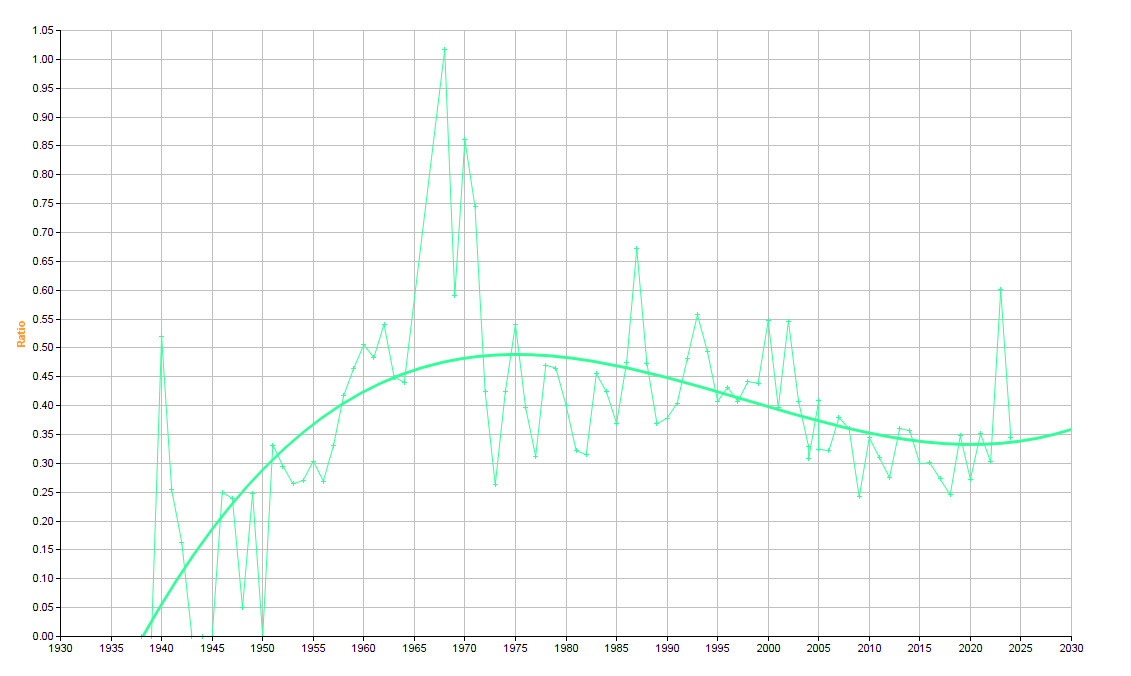
Next is the graph just for Denver. There’s a few interesting things here. First, the number I find is much lower than expected, since relatively speaking few make it this far east. Second, you can see a general trend of finding slightly more of them from earlier years, I suspect as they’ve had longer to work their way east. Third, there’s a big bump in the late 60s and early 70s. No nickels were minted in Philadelphia 1968-1970, and few in 1971 vs Denver, so I suspect many were shipped by the Mint to the east coast. Finally you can see the effects of the removal of silver War nickels, and the overall low mintage numbers from Denver in the late 1930s and after the war in the late 1940s.
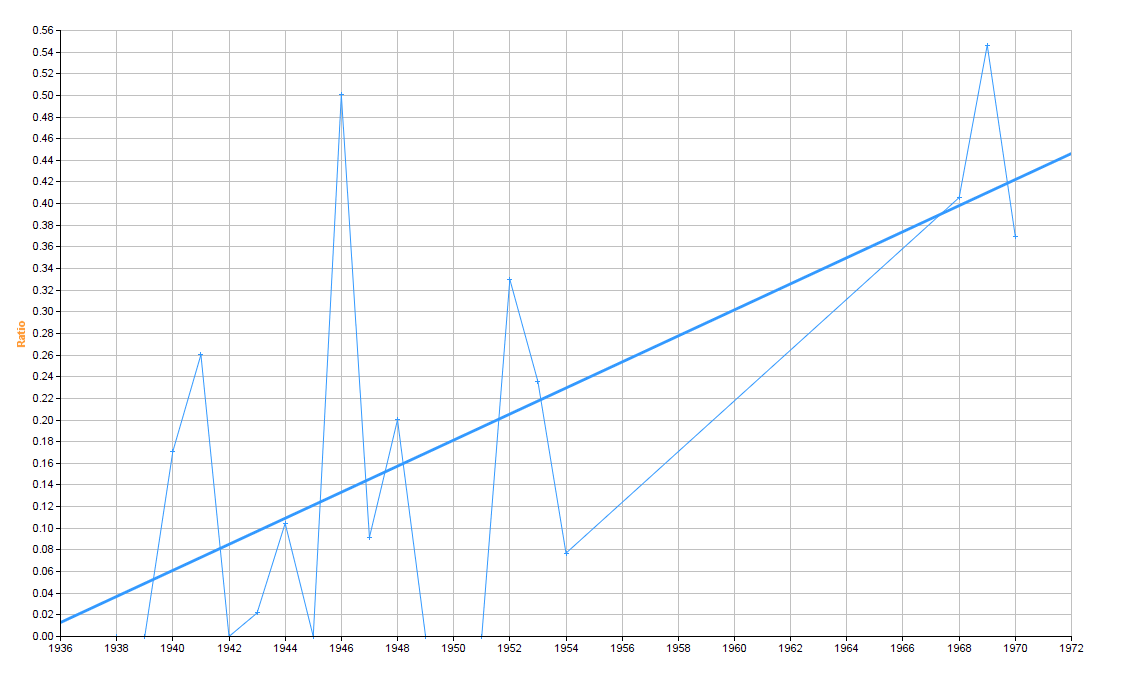
And here’s the graph for San Francisco. I don’t have a lot of data as I have only found 108 nickels from San Francisco in 16 boxes, vs 6,397 from Denver and 25,470 from Philadelphia. So that makes the graph quite noisy. And there’s the huge gap 1955-1967 with no S mint mark nickels, and then only 1968-1970 after that. The 1946-S blip really sticks out, but it only represents a total of 3 nickels! So it’s likely a statistical aberration due to a small sample set.
The ratio of found vs expected to find non silver nickels from the 1940s is 0.27. For the silver War nickels, this drops to 0.024, or 8.8%. If we assume that the numbers should be the same if silver War nickels were not selectively removed from circulation, this suggests that about 91% of them have been selectively removed, or about 9 out of 10. To me, this sounds like a very believable estimate as collectors have been removing them from circulation for decades. And this is on top of what was “naturally” lost, only about 2.4% of silver War nickels minted appear to remain in circulation.
The ratio of found vs expected to find Buffalo nickels from the 1940s is 0.016. It’s difficult to estimate what the number should be for the time period 1913-1938 assuming no selective removal, other than lower than that for the 1940s. For the 1950s, it is 0.38. So maybe it’s something less than 0.20? That would also suggest that maybe 9 out of 10 Buffalo nickels have been selectively removed from circulation? Again this is a very wild guess, but probably in the ballpark. And this is on top of what was “naturally” lost, only about 1.6% of Buffalo nickels appear to remain in circulation.
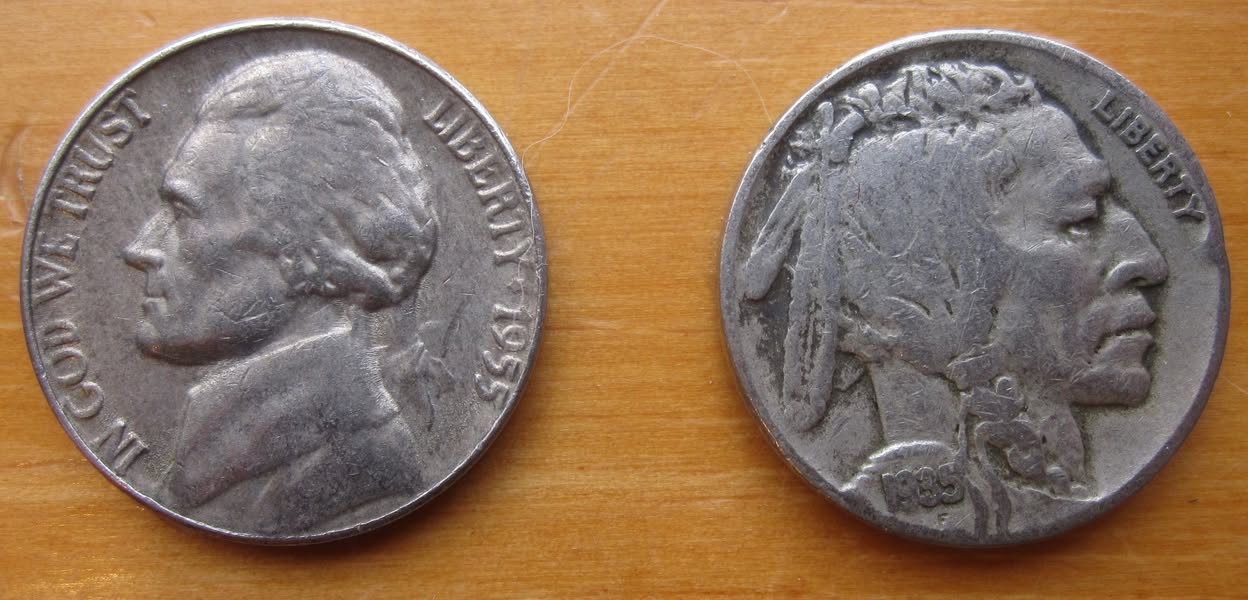
60 Boxes of nickels produced 33 Buffalo nickels and 35 silver War nickels. A total of 1,213 million Buffalo nickels were minted, and 870 million silver War nickels. Looking at ratios, 33/1213=0.272 and 35/870=0.040. So it does seem that fewer Buffalo nickels survive in circulation, relatively speaking probably due to a combination of those two factors. Buffalo nickels are also easier to spot and remove from circulation, they look substantially different.
Liberty/V nickels are even more speculative, as I have only found a total of four. The total mintage was 602 million, the ratio would be 0.0066. That’s significantly less than Buffalo nickels as expected, but I would not suggest the value itself is accurate.
Of course it’s important to note that all of this is based on what is admittedly a somewhat small sample set! I plan on continuing to search nickel boxes for some time, which will add more data. It will be interesting to see how the numbers change as more data is accumulated.
I welcome comments and suggestions on this analysis – please feel free to point out something I may have overlooked!