A Low Pass Filter For Longwave

Recently, I have been DXing DGPS (Differential GPS) stations on the longwave band. They occupy the region from 285 to 325 kHz. I’ve been getting some pretty good results with some custom software I wrote that demodulates all of the DGPS channels (1 kHz apart) in parallel from I/Q recording files from my SDR. This lets me analyze the entire band from a set of overnight recordings. That itself is the subject of another post I am working on.

I decided to build a low pass filter that just passes the longwave band, attenuating medium wave and shortwave, in an attempt to improve reception of weak DGPS signals.

The filter is flat to about 400 kHz, then starts attenuating. It is down about 30 dB at the start of the MW band (530 kHz) and reaches about 45 dB by 700 kHz, then eventually reaches about 50 dB. My strongest local MW stations are on 1280 and 1320 kHz, so I felt this was sufficient. I did not want to attenuate signals on the longwave band itself.

Below is a schematic of the filter. I used what components I had on hand, hence the paralleling of some of the inductors and capacitors. (Click on any of the images to enlarge them to full size)

I previously wrote about Building an RF Noise Generator For Testing Filters and included some plots showing the noise spectrum taken with an AFE822x SDR running the SdrDx software. Below is a plot of the noise generator fed directly into the SDR over the range of 100 to 1700 kHz.

Next is the spectrum with the filter installed. You can see the dramatic attenuation starting above about 400 kHz. (You can see an RFI noise source around 1300 kHz from elsewhere in my lab, which I have not yet tracked down)

Below you can see the entire MW and LW bands, this is without the filter and using my 500 ft beverage antenna:

Next, with the filter installed. Most of MW is knocked out, except for a few locals and stations on the lower end of the band. 580 is WHP in Harrisburg PA with 50 kW. A few more stages on the filter might be able to attenuate that some more, but I’m pretty happy with things already.

Below is an image of the filter itself, mounted in an aluminum enclosure:

And all bundled up, ready for use:

Decoding the Entire DGPS Band At Once

DGPS stations transmit the difference between positions indicated by GPS satellite systems and the known fixed position of the station. This allows higher accuracy. DGPS transmissions are 100 or 200 baud and are transmitted on frequencies from 285 kHz to 325 kHz in the longwave band. Hundreds of these stations are operated by the Coast Guard and other agencies around the world, and they can be interesting DX targets. Each station transmits a continuous stream of messages containing correction data for GPS. These messages also contain the station ID code, so they can be used to directly ID the station.

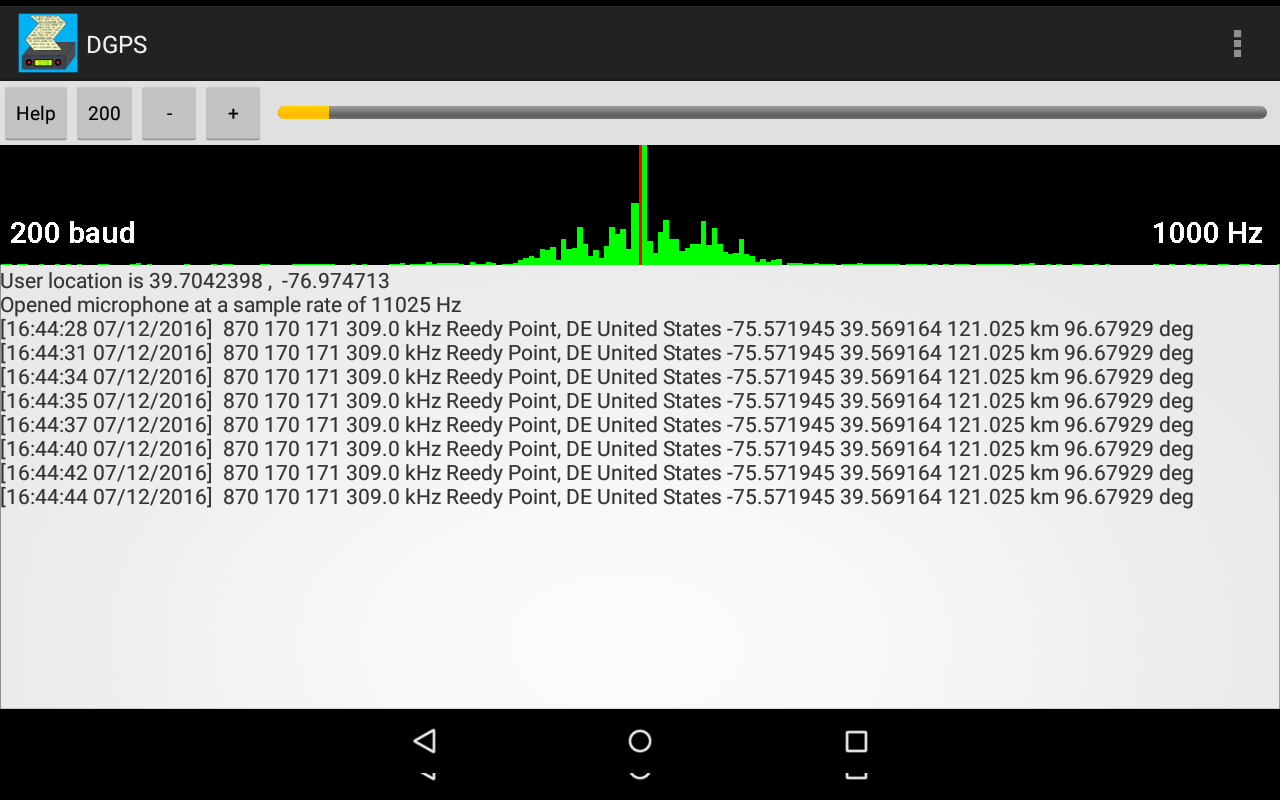
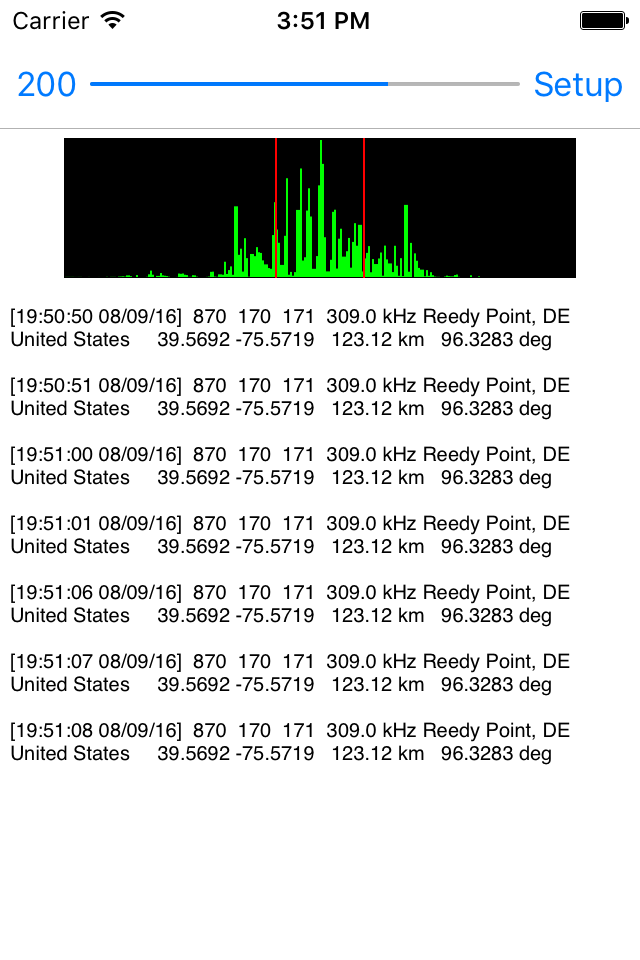
The usual way to DX these stations is to tune your receiver to a particular frequency, run your DGPS software (which I have for Android , iPad/iPhone and Mac OS X) set for one baud rate, and wait to see what station(s) are heard on that frequency. Then change baud rates, tune to the next frequency, and try again.

Since SDRs are capable of recording a chunk of the RF spectrum directly to a disk file, I realized that a decoder could be written to demodulate all of the DGPS channels at the same time, at both baud rates. They write this data as a I/Q file, storing the complex representation of a portion of the RF spectrum. A 50 kHz bandwidth is slightly more than enough to cover the entire DGPS band. I set my SDR software up to record overnight, then in the morning I can run the recordings through the software, and see what stations are present.

The software sets up 82 SSB demodulators, two for each of the DGPS channels, one is for decoding 100 baud and the other for 200 baud, that allows me to use a more narrow filter for the 100 baud case. The output of each demodulator goes to a DGPS decoder that looks for valid messages. A message is considered valid if it starts with the correct preamble byte, is of message type 6 or 9 (the most common sent), has a z-count (which is a time code offset from the hour) that is within a few seconds of what it should be, and passes the 6 bit parity word test. This eliminates the vast majority of bad message decodes, although every so often one will sneak through. This is because you can get multiple bit errors on a message that corrupt both the data and parity word in such a way that the parity check still passes. It is still necessary to visually inspect the decodes, and decide if a seemingly amazing DX catch is realistic, or more likely just a bad decode.

Below is a screenshot showing the output of approximately 24 hours of recordings of the DGPS band.

The columns containing the following information:
• Count: the number of decodes of this station.
• ID: ID number of the station, stations transmit either the ID or one of the reference IDs.
• RefID1: The first reference ID of the station.
• RefID2: The second reference ID of the station.
• kHz: Frequency.
• Baud: The baud rate, 100 or 200.
• City: Station Location.
• Country: Station Location.
• Lat: Station latitude.
• Lon: Station longitude.
• km: The distance to the station from your location.
• deg: The bearing to the station from your location.

Below is a text copy of the data:

   Count   ID ref1 ref2  kHz Baud                           City              Country      Lat      Lon     km Deg 
      22  918  310  311  286.0  200                    Wiarton, ON               Canada    44.75   -81.12    655 330 
   94810  804    8    9  286.0  200                 Sandy Hook, NJ        United States    40.47   -74.02    267  70 
     117  886  272  273  287.0  100               Fort Stevens, OR        United States    46.21  -123.96   3772 296 
   17277  942  340  341  288.0  200                   Cape Ray, NL               Canada    47.64   -59.24   1667  52 
     680  809   18   19  289.0  100             Cape Canaveral, FL        United States    28.47   -80.55   1288 195 
   43711  806   12   13  289.0  100                     Driver, VA        United States    36.96   -76.56    306 172 
    7955  869  168  169  290.0  200                 Louisville, KY        United States    38.02   -85.31    742 258 
   22384  799   44   45  290.0  200                  Penobscot, ME        United States    44.45   -68.78    858  49 
     318  836  112  113  292.0  200                  Cheboygan, MI        United States    45.66   -84.47    899 319 
   22854  778  192  193  292.0  100                 Kensington, SC        United States    33.49   -79.35    721 197 
   45542  803    6    7  293.0  100                   Moriches, NY        United States    40.79   -72.76    379  69 
     255  814   28   29  293.0  200               English Turn, LA        United States    29.89   -89.95   1601 231 
   44167  771  196  197  294.0  100                   New Bern, NC        United States    35.18   -77.06    502 180 
   25472  929  312  313  296.0  200          St Jean Richelieu, QC               Canada    45.32   -73.32    693  24 
    1519  830  100  101  296.0  100            Wisconsin, Point WI        United States    46.71   -92.03   1438 307 
   50006  792  136  137  297.0  200                       Bobo, MS        United States    34.13   -90.70   1361 247 
    2018  937  330  331  298.0  200              Hartlen Point, NS               Canada    44.58   -63.45   1237  59 
    9872  831  102  103  298.0  100             Upper Keweenaw, MI        United States    47.23   -88.63   1252 315 
   22843  866  162  163  299.0  200                   Sallisaw, OK        United States    35.37   -94.82   1635 258 
   20580  926  318  319  300.0  200            Riviere du Loop, QC               Canada    47.76   -69.61   1072  31 
     692  871  172  173  300.0  100                   Appleton, WA        United States    45.79  -121.33   3584 295 
       1  828  246  247  301.0  100                   Angleton, TX        United States    29.30   -95.48   2035 241 
   97637  847   58   59  301.0  200                  Annapolis, MD        United States    39.02   -76.61     82 156 
      42  972  901  902  302.0  200                     Miraflores               Panama    8.99    -79.58   3384 184 
      73  881  262  263  302.0  100                 Point Loma, CA        United States    32.68  -117.25   3613 270 
      10  816   32   33  304.0  100               Aransas Pass, TX        United States    27.84   -97.07   2255 240 
   43885  777  218  219  304.0  200                     Mequon, WI        United States    43.20   -88.07    998 296 
      64  919  308  309  306.0  200                   Cardinal, ON               Canada    44.78   -75.42    579  12 
   85388  772  198  199  306.0  200                   Acushnet, MA        United States    41.75   -70.89    562  64 
    1196  934  336  337  307.0  200                 Fox Island, NS               Canada    45.36   -61.10   1440  58 
     568  971  903  904  307.0  200                          Gatun               Panama    9.26    -79.94   3358 185 
     899  927  316  317  309.0  200                     Lauzon, QC               Canada    46.82   -71.17    920  28 
   88266  870  170  171  309.0  200                Reedy Point, DE        United States    39.57   -75.57    123  96 
    3939  944  342  343  310.0  200                Cape Norman, NL               Canada    51.51   -55.83   2082  44 
   33700  863  156  157  311.0  200                 Rock Island IL        United States    42.02   -90.23   1139 287 
    3263  935  334  335  312.0  200               Western Head, NS               Canada    43.99   -64.67   1123  60 
   18438  827  244  245  312.0  200                      Tampa, FL        United States    27.85   -82.54   1410 202 
    7487  925  320  321  313.0  200                      Moise, QC               Canada    50.20   -66.12   1440  32 
     269  764  210  211  314.0  200                    Lincoln, CA        United States    38.85  -121.36   3723 283 
   28554  808   16   17  314.0  200                 Card Sound, FL        United States    25.44   -80.45   1613 192 
    3502  940  338  339  315.0  200                  Cape Race, NL               Canada    46.66   -53.08   2068  60 
   14236  864  158  159  317.0  200             St Paul [Alma], MN        United States    44.31   -91.91   1328 297 
     115  936  332  333  319.0  200            Point Escuminac, NB               Canada    47.08   -64.80   1277  46 
   66589  838  116  117  319.0  200                    Detroit, MI        United States    42.31   -83.10    587 301 
   19514  865  160  161  320.0  200              Millers Ferry, AL        United States    32.10   -87.40   1258 231 
   14448  862  154  155  322.0  200                   St Louis, MO        United States    38.62   -89.76   1104 267 
    9262  839  118  119  322.0  100                 Youngstown, NY        United States    43.24   -78.97    426 337 
   83262  844   94   95  324.0  200               Hudson Falls, NY        United States    43.27   -73.54    490  34 

Most likely the Wiarton and Angleton decodes are corrupted messages, as the frequencies they use are both dominated by strong semi local signals.

Another way to look at the decoded data is with this graph, that shows the times that messages were received from each station (click to view full sized):

You can see the various times stations were decoded. There are cases where a single decode was received (just a thin line), which was possibly a garbled message. But there are also cases for DX stations where several messages in a row were received (a thicker line). It is quite improbable that many messages were garbled in a row, with exactly the necessary bit errors to change the ID of the station, but also preserve the parity word check.

It is interesting to observe how two stations on a given frequency will alternate reception, as one fades out and the other fades in.

A very preliminary beta version of this program, Amalgamated DGPS, is available for download for those who wish to try it. It is only for Mac OS X, and requires I/Q recording files made in either the RF Space or Perseus format (and note that I have only tested with the former, the latter should work, but you never know). While there is no Windows version available at present, I may have one available shortly, so stay tuned!

Building an RF Noise Generator For Testing Filters

It’s often handy to have an RF noise generator when testing various circuits, especially filters. I was working on a low pass filter for long wave, and wanted a way to measure the performance of the filter.

This is the noise generator I came up with. It’s a fairly simple circuit:

A zener diode as the noise source. Zener diodes, when conducting a very low current, produce a wide spectrum of noise. In this case I used a 6.8 volt zener diode, similar values should work as well.
A single NPN transistor used to amplify the noise form the zener diode.
A variable resistor to adjust the current through the zener diode for maximum noise.
Three resistors, four capacitors, and an inductor (to filter out noise you don’t want, from the power supply).

In my case, I powered the generator from a 12 volt DC power supply, you could use a 9 volt battery as well, if you wish.

Below is the schematic (you can click on any of the images to see them full sized):

The incoming DC power is filtered by the inductor and two capacitors.

Next it goes through the variable resistor as well as a fixed 10K resistor, so that the maximum current through the zener diode is limited to a safe value during adjustment. The noisy zener diode current is then applied to the base of the transistor, used as a common emitter amplifier. I used a 2N3904, other values should work as well, though you may need to adjust resistor component values. The 0.1 uF capacitor keeps the voltage on the zener diode relative constant.

The 680 and 1000 ohm resistors in parallel are values I had in my parts bin, suitable to use in parallel based on the current to the base of the transistor. The transistor output is the AC coupled through another 0.1 uF capacitor.

Below is a photograph of the circuit, build on the lid of a 1 pint paint can. I have a number of these from geiger tubes that I purchase for use in radiation detectors that you can plug into your computer for experiments as well as long term measurements and graphing. Hey, want to buy one of my geiger counters? Full details are here: http://www.blackcatsystems.com/GM/GeigerCounters.html

OK, back to the noise generator. The paint can lids are handy for prototyping RF circuits. You can built them dead bug style on the bottom side of the lid, test them out, then put them on the can for your RF shield, as shown below. The two connectors are a BNC jack for the RF output, as well as a standard DC power jack for the power supply.

For looking at the generated noise spectrum, I used the fabulous SdrDx SDR software by Ben, AA7AS, along with an AFE822x SDR.

Below is the noise level with the RF noise generator powered off (you can see an RFI noise source around 1300 kHz from elsewhere in my lab, which I have not yet tracked down):

And with it powered on:

The increase in noise level is about 50 dB, very suitable for testing filters and such.

DXing DGPS Stations with Your Android or iPhone / iPad

Looking for a new set of stations to DX? You might want to consider DGPS stations, heard on the long wave band.

DGPS stations transmit the difference between positions indicated by GPS satellite systems and the known fixed position of the station. This allows higher accuracy. DGPS transmissions are 100 or 200 baud and are transmitted on frequencies from 285 kHz to 325 kHz. Hundreds of these stations are operated by the Coast Guard and other agencies, and they can be interesting DX targets.

A pair of apps allow you to decode these transmissions on your smartphone or tablet. There’s the Android version of DGPS decoder was well as the iPhone/iPad version of DGPS Decoder. It is also available for the Kindle Fire on the Amazon App Store.

I wrote a previous article about how to use MultiMode to decode these transmissions on your Mac.

Here’s screenshots of the two apps in use, you can click on them to enlarge them:

You’ll need a radio that can tune the 285 kHz to 325 kHz range in SSB or CW mode. To decode the transmission, tune your radio to a DGPS frequency. You can either tune directly to the frequency in CW mode, in which case you set the center frequency in this app to frequency of the tone produced by your radio in CW mode, usually close to 800 Hz, or use USB mode, tune 1 kHz low, and set the center frequency in the app to 1000 Hz.

You can listen to an example DGPS audio recording, which you can also use to test out the apps, and practice correctly tuning in the transmissions, before trying for some actual stations on your radio. This example is 200 baud, with a center frequency of 1000 Hz.

A typical decoded message looks like this:

[23:24:00 08/08/16] 806 12 13 289.0 kHz Driver, VA United States 36.9633 -76.5622 306.61 km 172.711 deg

First the current UTC date and time are printed in brackets.
Then the station ID, 806 in this case, as well as the two reference IDs, 12 and 13 in this case.
That is followed by the assigned frequency, 289.0 kHz for this station. You can compare this value to what your radio is tuned to, they should match. If they don’t, then ignore this message, as it was incorrectly received. With weak signals, it is common to receive incorrect messages, because static or other interference has corrupted some of the bits. Just ignore them.
The location of the station is then displayed, the city, state, and country, followed by the station location.
Then the distance and bearing to the station is displayed, providing you have correctly set your location in the app.

Here’s a list of some stations I have previously received here with a modest 200 ft random wire antenna:

286.0 kHz Sandy Hook, NJ United States 40.4747 -74.0197 235.632 km
306.0 kHz Acushnet, MA United States 41.7492 -70.8886 529.571 km
305.0 kHz Dandridge, TN United States 36.0225 -83.3067 723.745 km
311.0 kHz Rock Island IL United States 42.0203 -90.2311 1245.06 km
289.0 kHz Driver, VA United States 36.9633 -76.5622 231.719 km
291.0 kHz Hawk Run, PA United States 40.8889 -78.1889 280.839 km
293.0 kHz Moriches, NY United States 40.7944 -72.7564 340.978 km
294.0 kHz New Bern, NC United States 35.1806 -77.0586 434.825 km
295.0 kHz St Mary's, WV United States 39.4381 -81.1758 448.281 km
297.0 kHz Bobo, MS United States 34.1253 -90.6964 1414.92 km
301.0 kHz Annapolis, MD United States 39.0181 -76.61 52.734 km
303.0 kHz Greensboro, NC United States 36.0694 -79.7381 463.251 km
304.0 kHz Mequon, WI United States 43.2025 -88.0664 1110.64 km
307.0 kHz Hagerstown, MD United States 39.5553 -77.7219 160.52 km
296.0 kHz St Jean Richelieu, QC Canada 45.3244 -73.3172 736.38 km
322.0 kHz St Louis, MO United States 38.6189 -89.7644 1190.3 km
292.0 kHz Cheboygan, MI United States 45.6556 -84.475 1013.8 km
314.0 kHz Card Sound, FL United States 25.4417 -80.4525 1560.45 km
288.0 kHz Cape Ray, NL Canada 47.6356 -59.2408 1650.3 km
290.0 kHz Louisville, KY United States 38.0175 -85.31 816.337 km
292.0 kHz Kensington, SC United States 33.4906 -79.3494 681.801 km
313.0 kHz Moise, QC Canada 50.2025 -66.1194 1464.05 km
302.0 kHz Point Loma, CA United States 32.6769 -117.25 3697.45 km

Faux Deep Dish Pizza (Relatively Low Carb)

I love pizza, but it’s not a low carb food. This is my close substitute, a variant of deep dish pizza, made without a crust in a casserole dish.

Ingredients:
3 15 oz cans Don Pepino pizza sauce
2 13 oz cans mushrooms
3 8 oz bags of shredded mozzarella
44 slices pepperoni

Nutritional info for the entire pizza:
4585 calories
324 grams fat
275 grams protein
105 grams carbohydrates (fiber has been subtracted)

Per serving nutritional info, I get four servings out of it, you may get more or less:
1146 calories
81 grams fat
69 grams protein
26 grams carbohydrates

It is not super low carb, but it is fairly low carb. It’s not really LCHF (Low Carb High Fat) but it is close, if your carbs for the rest of the day really are zero.

Directions:

Preheat the oven to 350F, or 325F if you use convection mode (which I do).

Drain the pizza sauce in a sieve to remove as much of the liquid as you can, so the resulting pizza will not be too soupy.

While doing that, cook the sausage in a pan.

Put a thin layer of the pizza sauce on the bottom of the casserole dish.

Sprinkle mozzarella cheese on top of the sauce, about one packet, maybe a bit less. Then add about half of the sausage and one can of drained mushrooms.

Put another layer of cheese on top, then half the pepperonis, for my casserole dish I find I can fit 22 of them.

Then put the rest of the sausage and another drained can of mushrooms on top.

Then put the rest of the cheese on top, then put the rest of the pizza sauce on that.

Bake for one hour.

Remove, turn off the oven, and add pepperoni on top, place back in the oven and finish for about 10 or 15 minutes until the pepperoni has crisped up a bit.

Enjoy!

Running an RTL SDR USB Dongle On Your Mac The Easy Way With Cocoa RTL Server

I’ve had a few of the RTL radio tuner dongles for a while. These are USB devices that were originally made for use as TV tuners overseas, but it turns out that you can access the I/Q data stream, and turn them into an SDR (Software Defined Radio). They can be tuned roughly over a range of 25 to 1700 MHz, and sometimes even higher, depending on the tuner IC chip inside the particular dongle.

I previously posted about how to get the RTL dongle working on the Mac here: An SDR for $17 – The R820T USB RTL-SDR DVB-T Dongle and here: An SDR for $17 – The R820T USB RTL-SDR DVB-T Dongle – Part 2. These posts were from 2013, and I did the installation on a Mac running OS X 10.6, using some pre-built libraries.

Fast forward to the present day. I got a new Mac running OS X 10.11 El Capitan, and I wanted to be able to use the RTL dongles with my favorite SDR software on the Mac, SdrDx. Enter Cocoa RTL Server.

Cocoa RTL Server is a stand alone app that interfaces with an RTL dongle. It does not require you to build or install any drivers or libraries. It just works. It’s based off of an open source app called SoftShell, that I heavily extended. Cocoa RTL Server also acts like a networked SDR, following the RF Space protocol. That means it works with SdrDx, as well as any other SDR app on the Mac that supports RF Space SDRs like the netSDR. You can download a copy of the app from the Cocoa RTL Server page. Source code is included, however I am not offering any support for the project or final app.

Here’s a screenshot of the app running:

Getting up and running is easy:

1. Plug in your RTL device
2. Run CocoaRTLServer 2.0
3. Select the device from the popup menu (usually it is already selected)
4. Change the rtl_tcp or tx_tcp port values if needed
5. Click Open
6. Configure your SDR app (set the correct TCP port) and run it

I’ve run it under Mac OS X 10.6, 10.10 and 10.11, It should run under 10.7-10.9 as well. It only works with RTL devices with an E4000 or R820T tuner IC.

Using SdrDx, I can tune a large portion of the FM broadcast band, click to view full size:


In this case I am tuned to 97.9 MHz. To the left of the signal meter, you can see it has decoded the station ID from the RDS data. Yes, SdrDx decodes RDS.

If you look at the lower right corner, you see the scope display of the demodulated FM audio. There are markers for the portions of interest:
You can see the main audio above the green marker to the left.
The stereo pilot at 19 kHz (red marker).
The stereo subcarrier (aquamarine)
The RDS data (orange)
The 67 kHz SCA subcarrier (purple)
The 92 kHz SCA subcarrier (yellow)

Cocoa RTL Server also includes a server that emulates rtl_tcp, so it works with Cocoa1090 which decodes aircraft transponders that transmit on 1090 MHz. It should also work with any other app that gets data from rtl_tcp. Here’s a screenshot of Cocoa1090 running:


Using an SDR-14 or SDR-IQ with Mac OS X 10.11 El Capitan (Also applies to 10.10 Yosemite)

If you use an SDR-14 or SDR-IQ with Mac OS X 10.10 or 10.11, you may run into issues due to Apple’s built in FTDI USB driver, which prevents the FTDI D2XX library from accessing it. Previously you could just unload the driver when you wanted to run your SDR software, but Mac OS X 10.11 El Capitan compounds the problem by making that impossible under normal conditions. This is part of Apple’s System Integrity Protection (SIP), also known as “rootless” mode.

SIP prevents any user, even those with system administrator (“root”) privileges, modifying a number of operating system directories and files.

Unfortunately this also prevents you from stopping the use of Apple’s built in FTDI driver, which you must do in order to run applications that use FTDI’s D2XX library. In our case, to stop the use of Apple’s built in driver, we need to install a codeless kernel extension (kext). This extension claims priority over Apple’s built in driver, but doesn’t actually do anything, leaving the device available for the D2XX library to access it. It should also work under 10.9 Mavericks, making it unnecessary to unload the Apple kext each time you want to use your SDR.

Before continuing, please note that you perform all these steps at your own risk. Guaranteed to blow up your Mac. blah blah blah.

To disable SIP on Mac OS X 10.11 El Capitan:
1. Restart your Mac.
2. As soon as you hear the startup chime, hold down Command-R and keep it held down until you see the Apple icon and a progress bar.
3. After you have booted into Recovery Mode, select Terminal from the Utilities menu.
4. At the prompt type: csrutil disable
5. You should see a message saying that SIP was disabled.
6. Select Restart from the Apple menu.

If you’re running Mac OS X 10.10 Yosemite, you can disable kernel extension code signing:

1. Open the Terminal application
2. Type the following: kext-dev-mode=1
3. Press return and enter your administrator password
4. Reboot.

The next step is to install a codeless kernel extension. It won’t actually do anything, other then prevent the built in Apple FTDI USB driver from being used with the SDR. You can download unsigned codeless kernel extension (kext) files, along with a copy of the SDR-xx Server app, here: http://radiohobbyist.org/blog/mypics/SDR_14_IQ_Mac_OSX.zip

Under El Capitan and Yosemite, it needs to be installed in /Library/Extensions./
If you need to load an unsigned kext in Mavericks, it should be in /System/Library/Extensions/

For El Capitan and Yosemite, we would type the following at the Terminal prompt (assuming you’re in the directory containing the kext file):
sudo cp -r SDR14USBFTDICodelessKext.kext /Library/Extensions

In Mavericks:
sudo cp -r SDR14USBFTDICodelessKext.kext /System/Library/Extensions

For an SDR-IQ, you would use the file SDRIQUSBFTDICodelessKext.kext instead, as it has a different USB PID (Product ID).

You should then be able to plug in your SDR-14 or SDR-IQ, and see it is found by the SDR-xx Server app. Note that to run SDR-XX Server, libftd2xx.1.0.4.dylib needs to be installed in /usr/local/lib
cp libftd2xx.1.0.4.dylib /usr/local/lib

You can then run SdrDx or another SDR app that expects a networked SDR.

I can’t provide individual assistance with getting this to work, but feel free to post questions as comments, and maybe I or someone else can provide an answer.

Winter 2015-2016 Snowfall

Saturday December 19, 2015:
Trace snow.

December Total: Trace

2015-2016 Season Total: Trace

Monday January 4, 2016:
Flurries.

Tuesday January 12, 2016:
0.3″

Sunday January 17, 2016:
0.2″

Wednesday January 20, 2016:
0.3″

Friday January 22, 2016 – Saturday January 23, 2016:
28.0″

January Total: 28.8″

Friday February 5, 2016:
A dusting of snow while temperature were above freezing.

Tuesday February 9, 2016:
7.5″ as of 11:00 AM. Fairly wet and heavy snow. Above freezing for much of the time it fell.
Then 2.8″ in the evening for a total of 10.3″.
Some earlier pictures:


Friday February 12, 2016:
1.0″ of very light and puffy snow, I was able to clear the driveway with the leaf blower.

Monday February 15, 2016:
1.0″ of snow, later changing to sleet and some light freezing rain.

Thursday February 25, 2016:
Snow flurries.

Friday February 26, 2016:
Snow flurries.

February Total: 12.3″

Friday March 4, 2016:
1.6″ of snow.

Sunday March 6, 2016:
A dusting of snow.

Saturday March 19, 2016:
0.5″ of snow.

March Total: 2.16″

Sunday April 3, 2016:
A dusting of snow during a strong wind event.

Friday April 8, 2016:
Snow flurries.

Saturday April 9, 2016:
0.5″ of snow, also some graupel.

April Total: 0.5″

2015-2016 Season Total: 43.7″

Cocoa1090 Mode S (ADS-B) aircraft transponder decoder for Mac OS X

Cocoa1090 is a Mode S (ADS-B) aircraft transponder decoder for Mac OS X, written for use with RTL-SDR devices (RTL based USB tuner dongles). These transmissions are at 1090 MHz, and can be received at a distance of a few hundred miles, often even with a modest antenna.

Cocoa 1090 uses rtl_tcp, part of the free RTL-SDR package, to control the RTL device, and produce I/Q data.

Some tips for installing RTL-SDR are here: http://www.hfunderground.com/wiki/RTL-SDR

Cocoa1090 displays all received aircraft, including the altitude, heading, speed, and flight number, as well as the tail number and aircraft model (if it is part of the included database, you can add your own tail numbers). Some transponders include position information, this is also displayed if received, and used to map those planes (Click on the image below to see it full size):

Cocoa 1090 is free, a copy can be downloaded from the website: http://www.blackcatsystems.com/software/cocoa1090.html

Receiving DGPS Stations with MultiMode For Mac OS X

MultiMode for Mac OS X can decode DGPS (Differential Global Positioning System) transmissions. DGPS stations transmit the difference between positions indicated by GPS satellite systems and the known fixed position of the station. This allows higher accuracy. DGPS transmissions are 100 or 200 baud and are transmitted on frequencies from 285 kHz to 325 kHz. They can be interesting DX targets.

A copy of MultiMode can be downloaded here: http://www.blackcatsystems.com/download/multimode.html

To decode the transmission, tune your radio to a DGPS frequency. You can either tune directly to the frequency in CW mode, in which case you set the center frequency in MultiMode to that for your radio’s CW mode, or use USB mode, tune 1 kHz low, and set the center frequency to 1000 Hz.

You can listen to an example DGPS audio recording

Select the baud rate, either 100 or 200 baud, using the button. Also be sure to set your location so that the correct distance and bearing is calculated. Eventually, if you have tuned into a DGPS transmission that is strong enough, you will start seeing decode messages printed:

The Short Demod button can be toggled on, in which case MultiMode will look at a smaller part of the DGPS packet. This often allows decodes of weaker transmissions.

Note that since no error checking is performed on the packet, it is possible to get false decodes. To help determine if you are actually receiving the correct station, compare the printed frequency for that station to what your radio is tuned to, to verify they match. Also look for several decodes from the same station in a row, that indicates that you probably are really receiving that station.

Here’s a list of some stations I have received here with a modest 200 ft random wire antenna:

[15:44:47 11/19/15] 008 804 008 009 286.0 kHz Sandy Hook, NJ United States 40.4747 -74.0197 235.632 km 45.2895 deg
[19:27:49 11/19/15] 198 772 198 199 306.0 kHz Acushnet, MA United States 41.7492 -70.8886 529.571 km 53.1416 deg
[19:28:52 11/19/15] 190 782 190 191 305.0 kHz Dandridge, TN United States 36.0225 -83.3067 723.745 km 245.071 deg
[19:29:12 11/19/15] 156 863 156 157 311.0 kHz Rock Island IL United States 42.0203 -90.2311 1245.06 km 290.156 deg
[19:32:00 11/19/15] 012 806 012 013 289.0 kHz Driver, VA United States 36.9633 -76.5622 231.719 km 192.449 deg
[19:33:00 11/19/15] 184 788 184 185 291.0 kHz Hawk Run, PA United States 40.8889 -78.1889 280.839 km 319.079 deg
[19:33:24 11/19/15] 006 803 006 007 293.0 kHz Moriches, NY United States 40.7944 -72.7564 340.978 km 53.1725 deg
[19:33:37 11/19/15] 196 771 196 197 294.0 kHz New Bern, NC United States 35.1806 -77.0586 434.825 km 192.789 deg
[19:33:50 11/19/15] 092 843 092 093 295.0 kHz St Mary's, WV United States 39.4381 -81.1758 448.281 km 277.867 deg
[19:33:54 11/19/15] 136 792 136 137 297.0 kHz Bobo, MS United States 34.1253 -90.6964 1414.92 km 252.075 deg
[19:33:59 11/19/15] 058 847 058 059 301.0 kHz Annapolis, MD United States 39.0181 -76.61 52.734 km 272.373 deg
[19:36:40 11/19/15] 046 824 046 047 303.0 kHz Greensboro, NC United States 36.0694 -79.7381 463.251 km 226.48 deg
[19:40:01 11/19/15] 218 777 218 219 304.0 kHz Mequon, WI United States 43.2025 -88.0664 1110.64 km 298.697 deg
[19:41:11 11/19/15] 130 834 130 131 307.0 kHz Hagerstown, MD United States 39.5553 -77.7219 160.52 km 293.159 deg
[19:43:59 11/19/15] 312 929 312 313 296.0 kHz St Jean Richelieu, QC Canada 45.3244 -73.3172 736.38 km 16.5642 deg
[19:44:05 11/19/15] 154 862 154 155 322.0 kHz St Louis, MO United States 38.6189 -89.7644 1190.3 km 272.301 deg
[19:55:36 11/19/15] 112 836 112 113 292.0 kHz Cheboygan, MI United States 45.6556 -84.475 1013.8 km 319.521 deg
[20:32:19 11/19/15] 017 808 016 017 314.0 kHz Card Sound, FL United States 25.4417 -80.4525 1560.45 km 196.764 deg
[20:34:44 11/19/15] 340 942 340 341 288.0 kHz Cape Ray, NL Canada 47.6356 -59.2408 1650.3 km 49.1252 deg
[22:10:54 11/19/15] 168 869 168 169 290.0 kHz Louisville, KY United States 38.0175 -85.31 816.337 km 265.238 deg
[22:11:34 11/19/15] 192 778 192 193 292.0 kHz Kensington, SC United States 33.4906 -79.3494 681.801 km 207.126 deg
[22:20:26 11/19/15] 320 925 320 321 313.0 kHz Moise, QC Canada 50.2025 -66.1194 1464.05 km 28.7438 deg
[11:34:56 11/20/15] 262 881 262 263 302.0 kHz Point Loma, CA United States 32.6769 -117.25 3697.45 km 272.2 deg